|
|
|
|
|
|
|
|
March 16, 2023 | ISSUE 67 |
|
|
 |
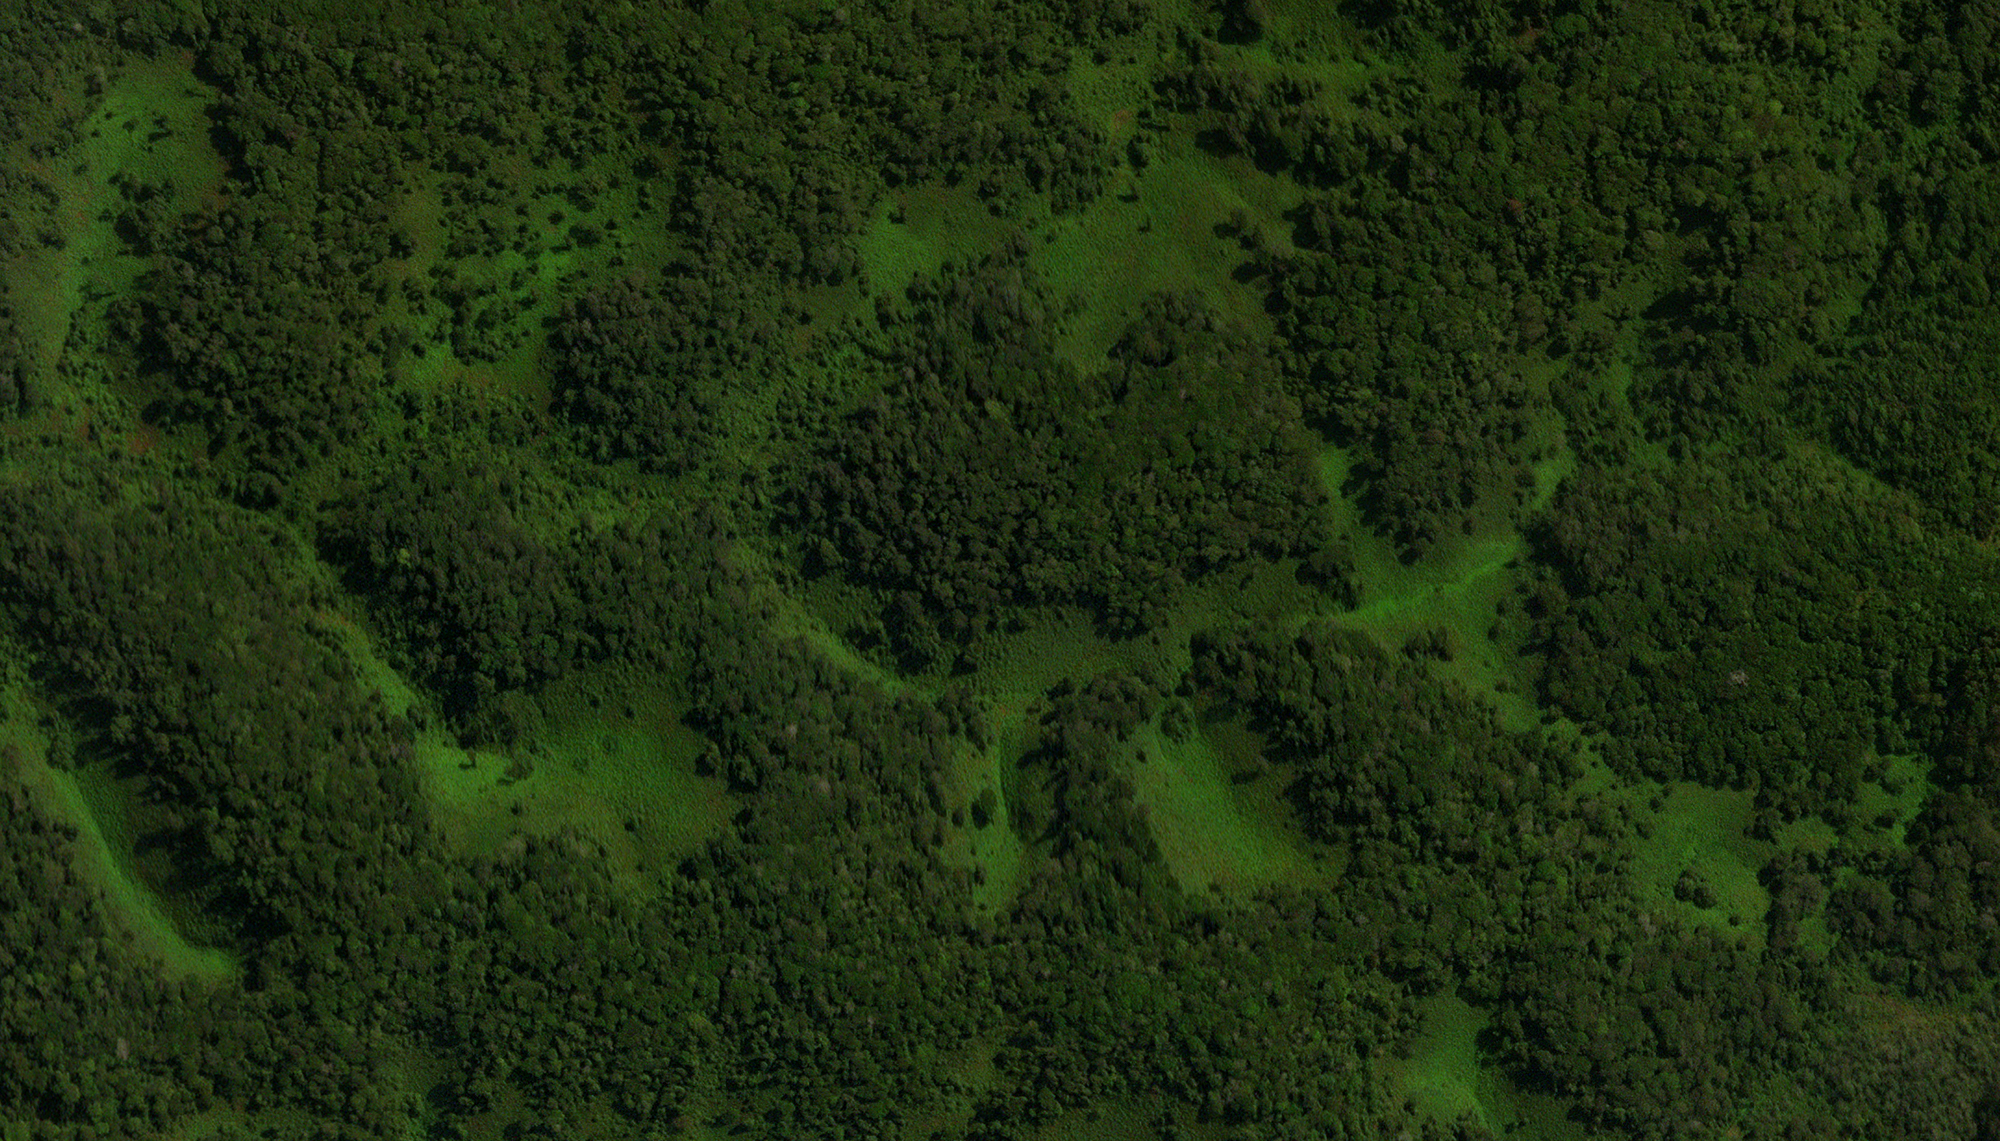
SkySat • Rondônia, Brazil • April 30, 2021 |
In this week’s issue:
Satellites establish terrestrial carbon baselines The rains flood Australia’s Northern Territory Drones and satellites pair up to get a closer look Having trouble viewing images? Then read this issue on Medium! |
|
|
|
|
FEATURE STORYCarbon Part 1: Terrestrial
Earth’s carbon cycle isn’t complicated. Unlike Cotton-Eyed Joe, we know where it comes from (continental crusts, oceans, soils, plants) and where it goes (the atmosphere). The trouble lies with the growing imbalance between these stocks as we release more carbon from materials than is pulled back out from the air. Our collective refrain isn’t a lyrical set of questions, but a call to reach carbon neutrality, aka net zero. This is the point where carbon emitted matches the carbon removed from the atmosphere.
It’s a target that governments and companies around the world have pledged and are striving to hit. But like an “it’s complicated” Facebook status, it’s hard to tell what’s really going on behind the curtains—especially when pledges to achieve net zero don't seem to jive with new carbon-emitting initiatives. The challenge is enormous but achievable. And certain technologies are enhancing our ability to take meaningful strides forward. So this week, in part 1 of our carbon series, we’re exploring how satellites are impacting the terrestrial carbon cycle.
|
 |
PlanetScope • Site of the Willow Project, National Petroleum Reserve Alaska, Alaska, USA • July 1, 2022 |
Carbon enters the atmosphere either naturally (i.e. volcanoes, decomposition) or by human activities. We emit it directly by burning fossil fuels but also indirectly by removing carbon sinks. Forests are an inexpensive and effective way to sequester carbon. It’s why the reforesting business is racing to catch up with the rapid disappearance of forests. Initiatives like One Tree Planted have planted over 50 million trees and use satellite data to track their growth. |
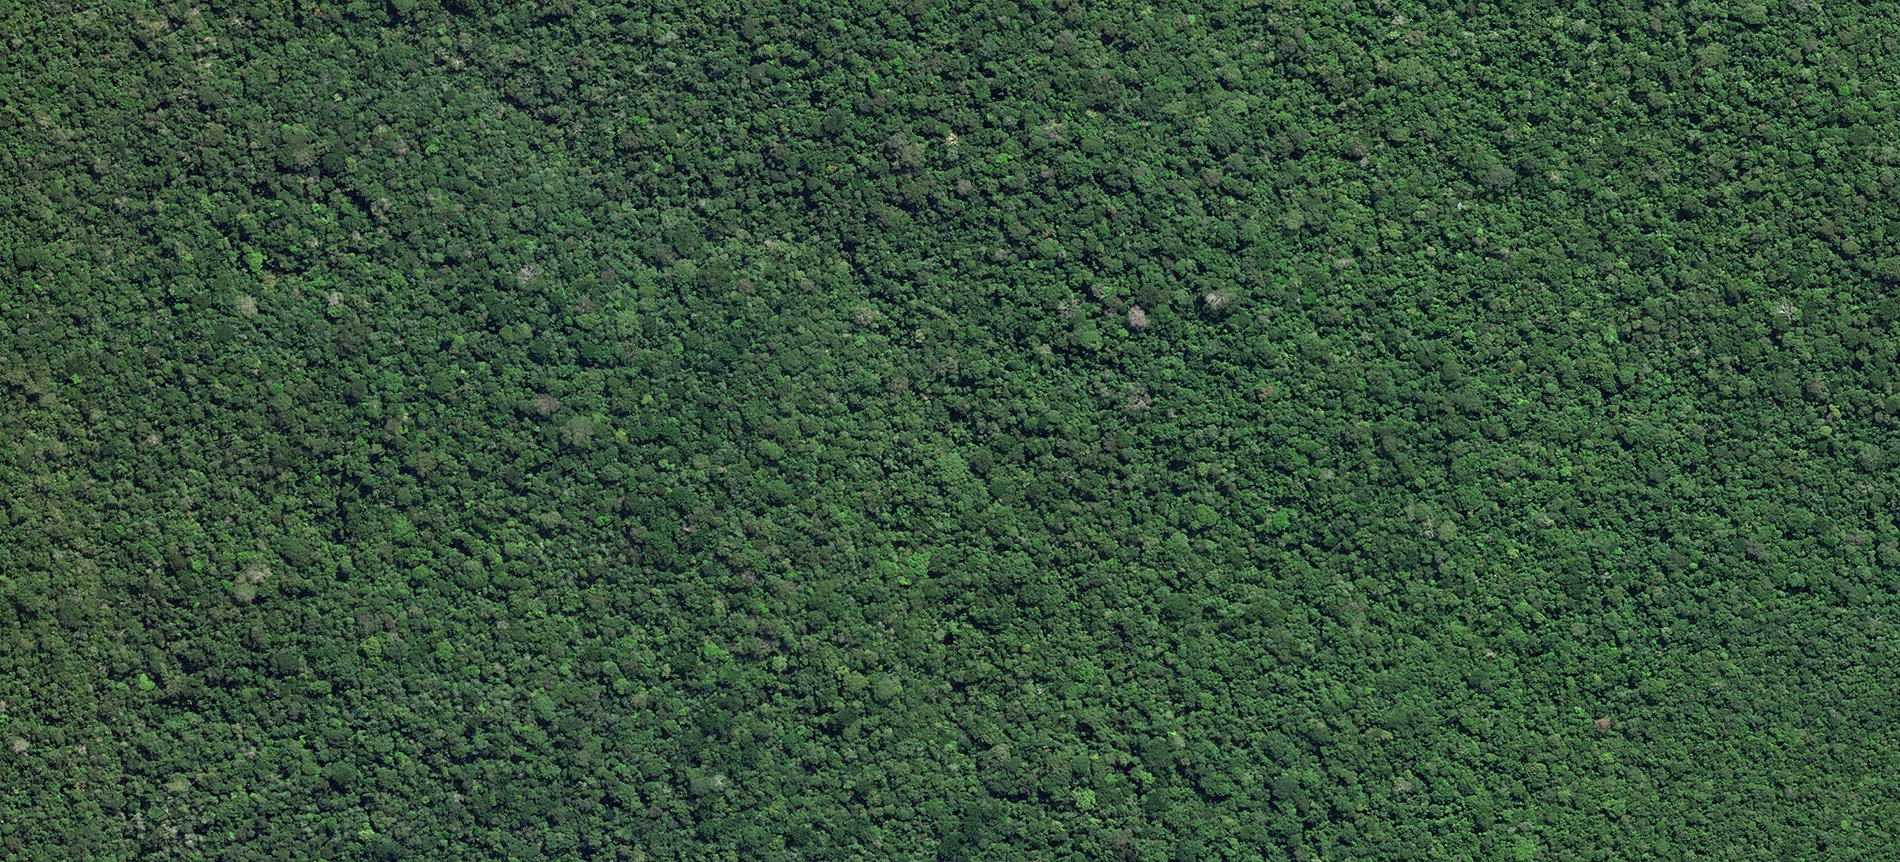 |
SkySat • Rondônia, Brazil • April 30, 2021 |
How many trees are in Rwanda? It may sound like a Google job interview prompt, but it’s actually a question researchers set out to answer. Formerly, tree cover maps often omitted trees found outside of forests. But scientists discovered that 72% of Rwanda’s trees were found in farmlands and savannahs after pairing satellite data with machine learning techniques. If you’re estimating carbon stocks and conservation targets on faulty data, you’re going to get faulty results. |
 |
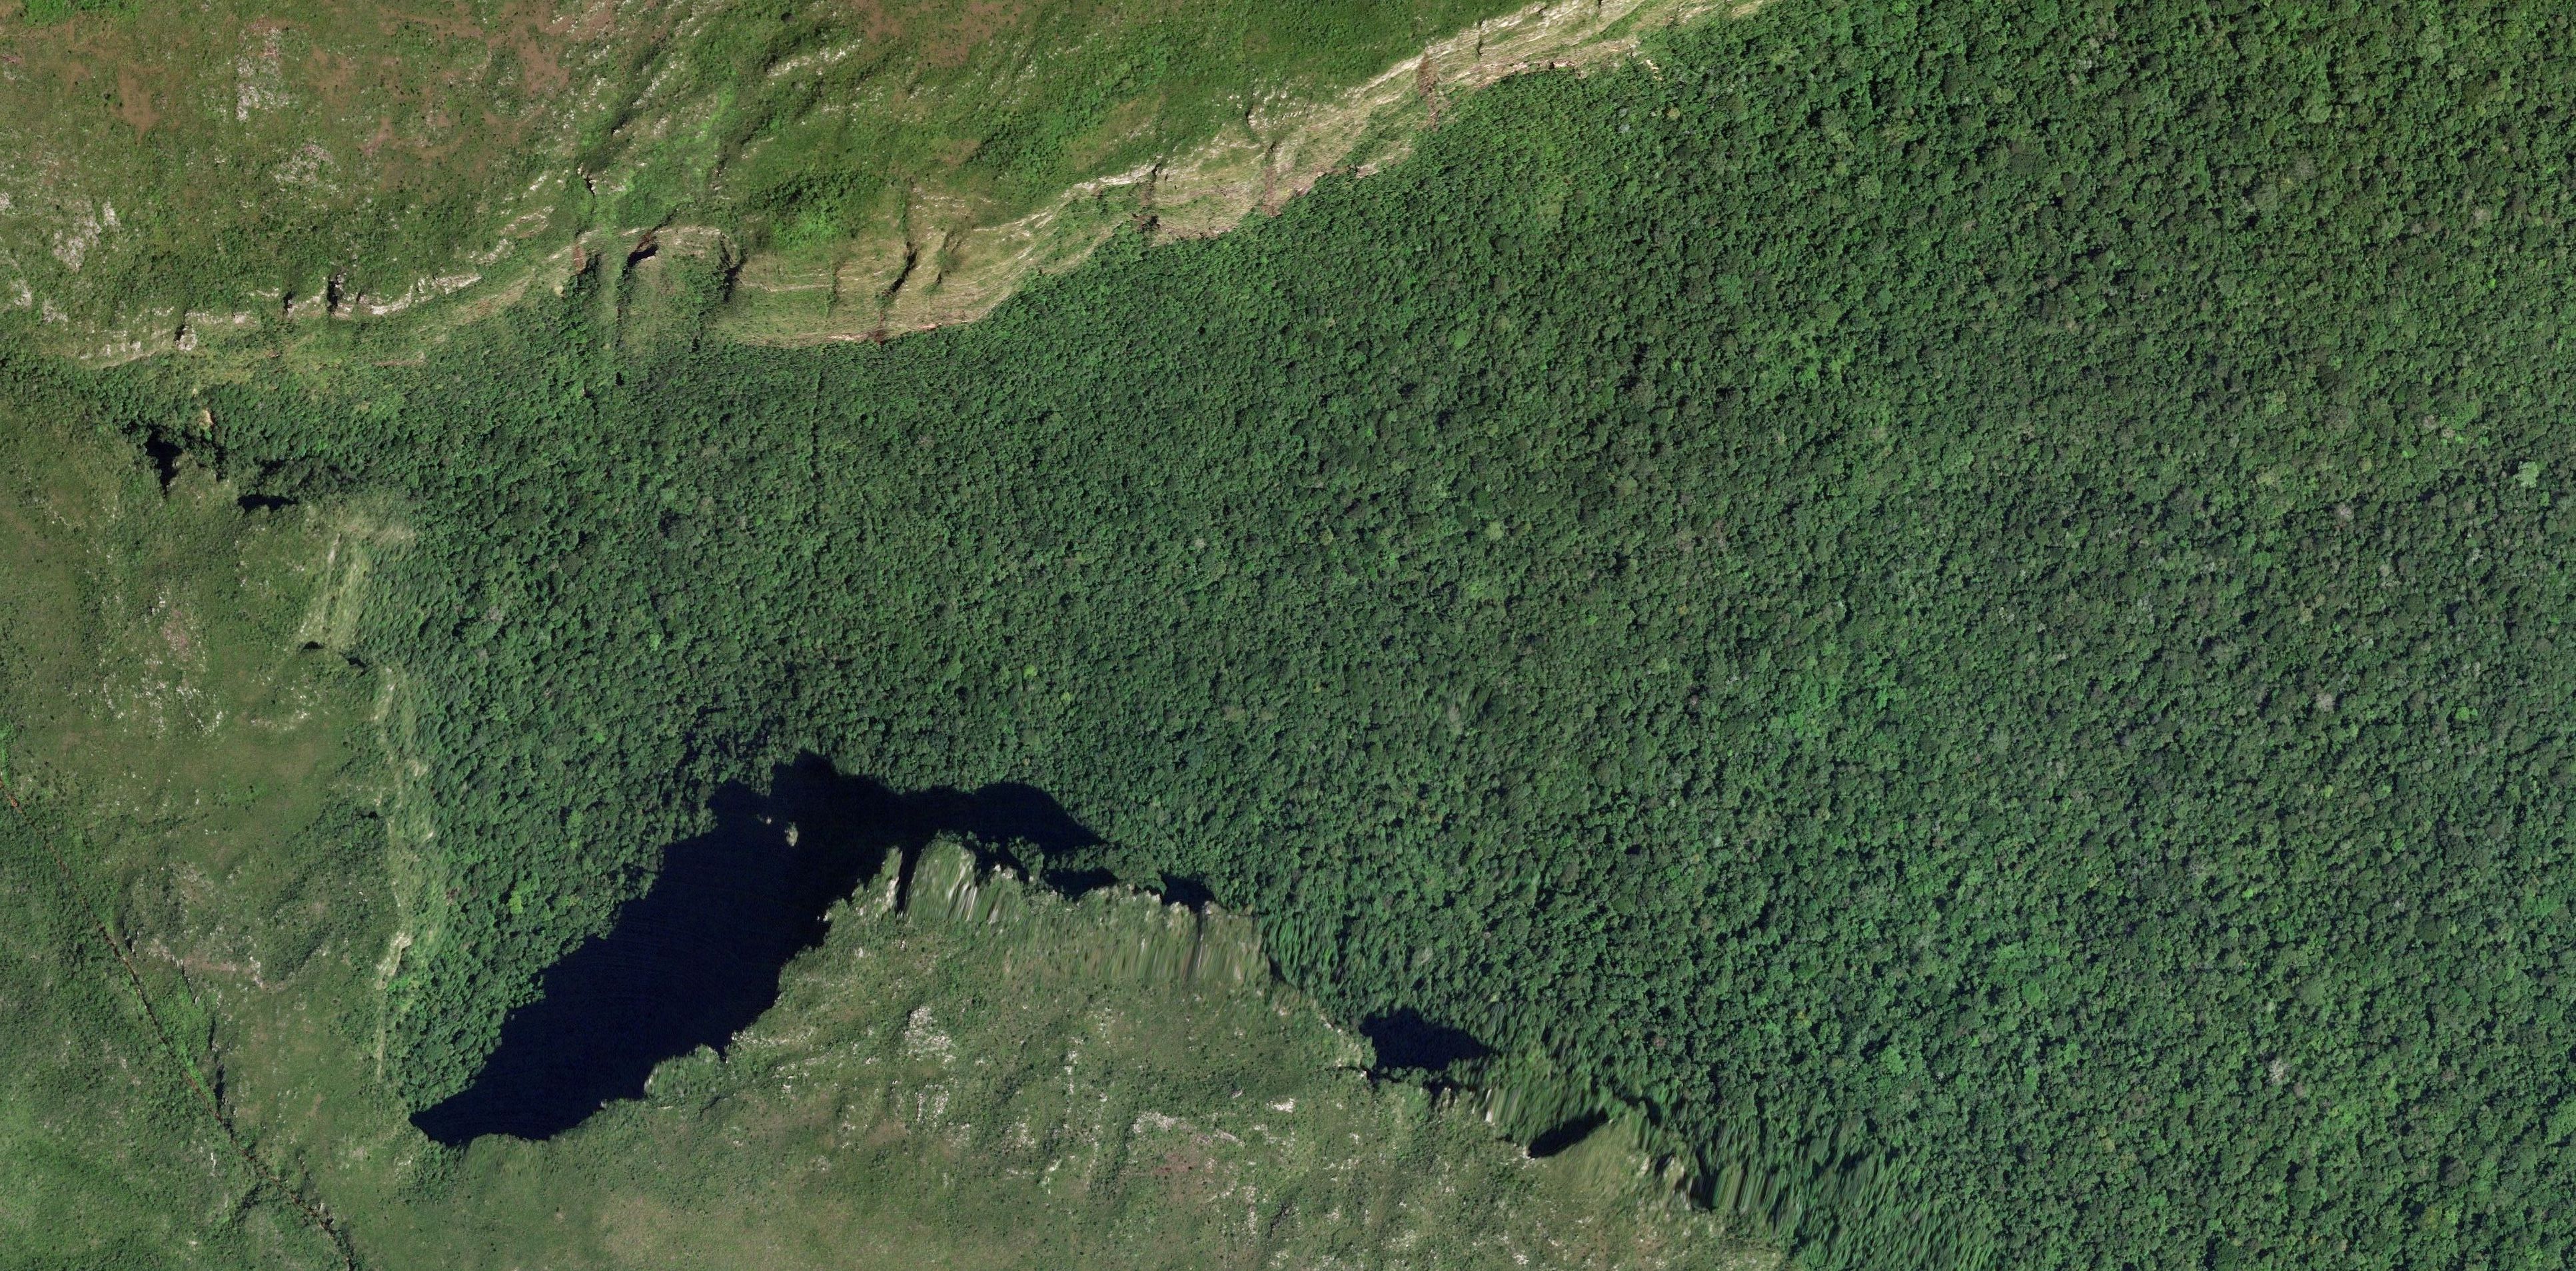
SkySat • Nyungwe National Park, Rwanda • September 23, 2022 |
A slightly easier solution than growing new trees is preserving ones already there. Deforestation jeopardizes not only the health of entire ecosystems but also any mitigations made elsewhere. If your goal is to cut carbon emissions, you need to know your baseline. Researchers at Arizona State University estimated deforestation-related carbon emissions with greater precision by using high resolution satellite data. They found that emissions were 24.3% higher than previous studies. |
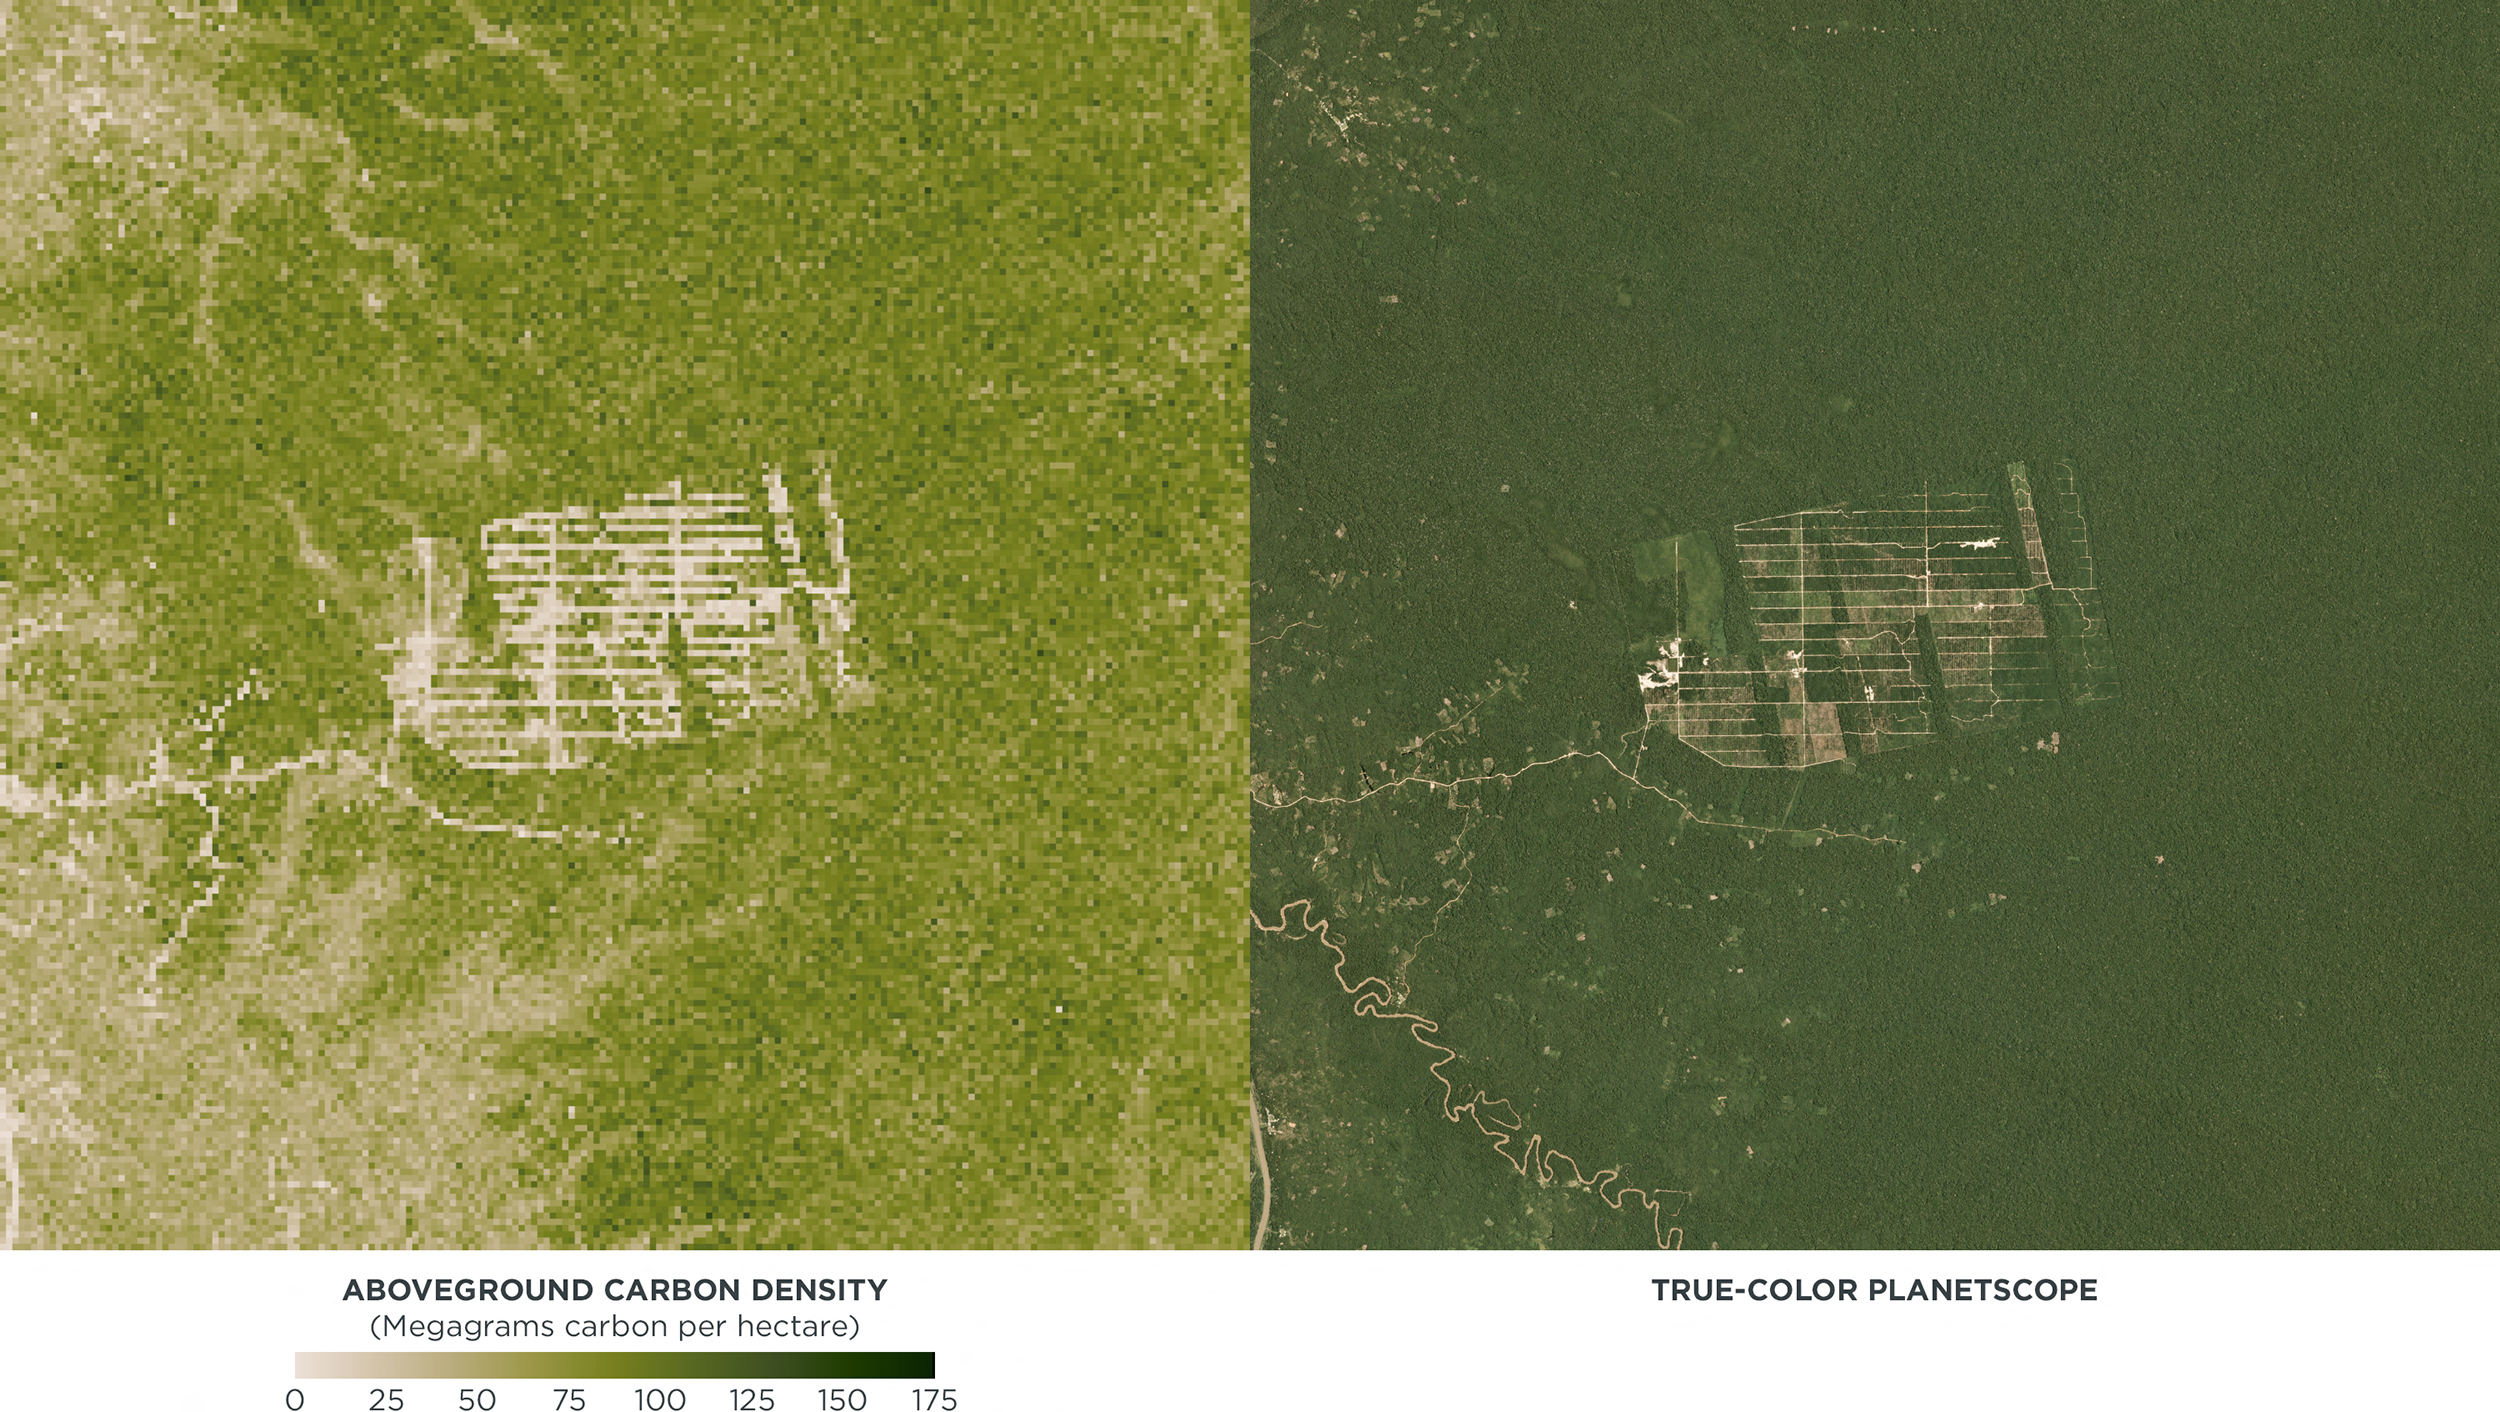 |
Planet & The Center for Global Discovery and Conservation Science • Carbon in biomass lost to cacao plantation, LIDAR data combined with PlanetScope data (right) • Tamshiyacu, Peru |
Unlike a Wild West bounty, trees are worth more dead than alive. At least as the markets stand today. Without adequate incentives for countries to protect their forests, many governments and local landowners stand to earn far more from the timber industry than carbon offsets. Carbon measurements need to be as accurate as possible. But without complementary policies encouraging their protection, these carbon sinks will continue to go down the drain. |
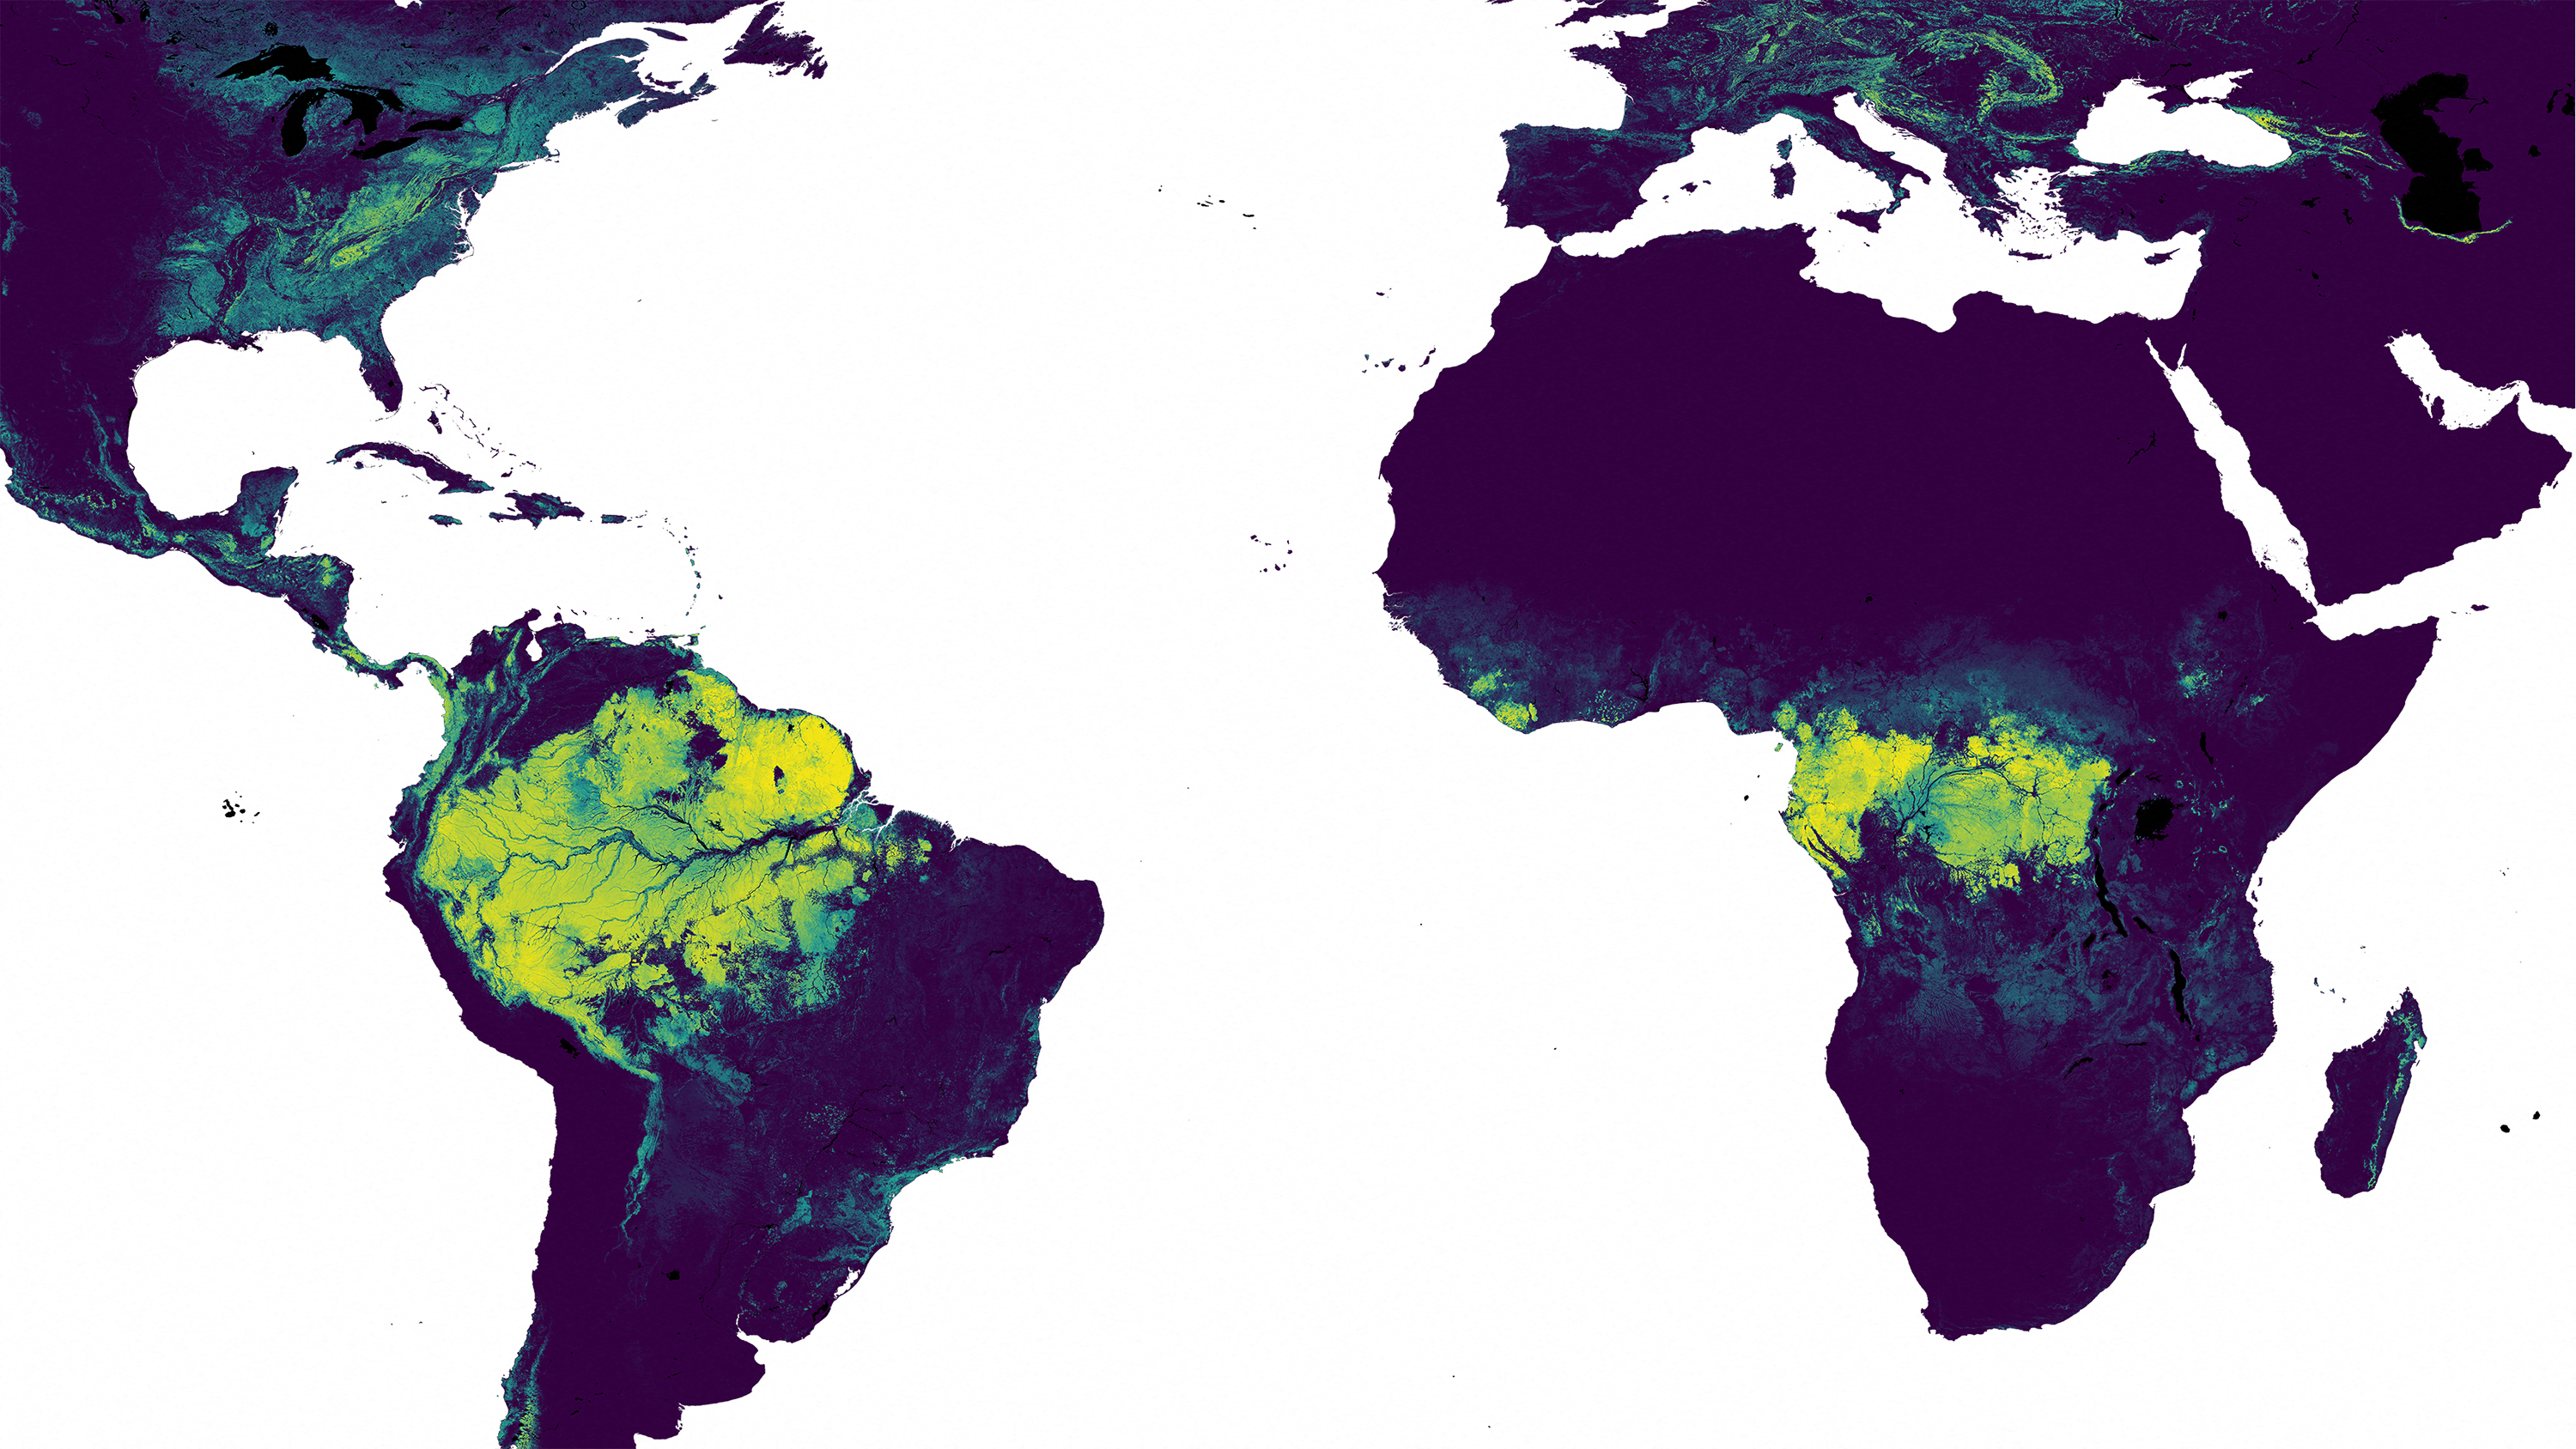 |
Salo Sciences / Planet Labs PBC • Map of aboveground forest carbon • Yellow is highest levels of carbon, green and blue indicate progressively less carbon, while dark purple areas are not forested • 2023 |
While important, deforestation is just one piece of the puzzle. Scientists can measure global increases in carbon dioxide. But dividing emissions by country, industry, or specific site is largely based on self-reported and spotty predictions. Climate Trace is changing that. This coalition combinines satellite data and machine learning to estimate up-to-date emissions from power plants to cargo ships. It’s an accountability game changer and a major breakthrough for “who dealt it” accusations. |
 |
|
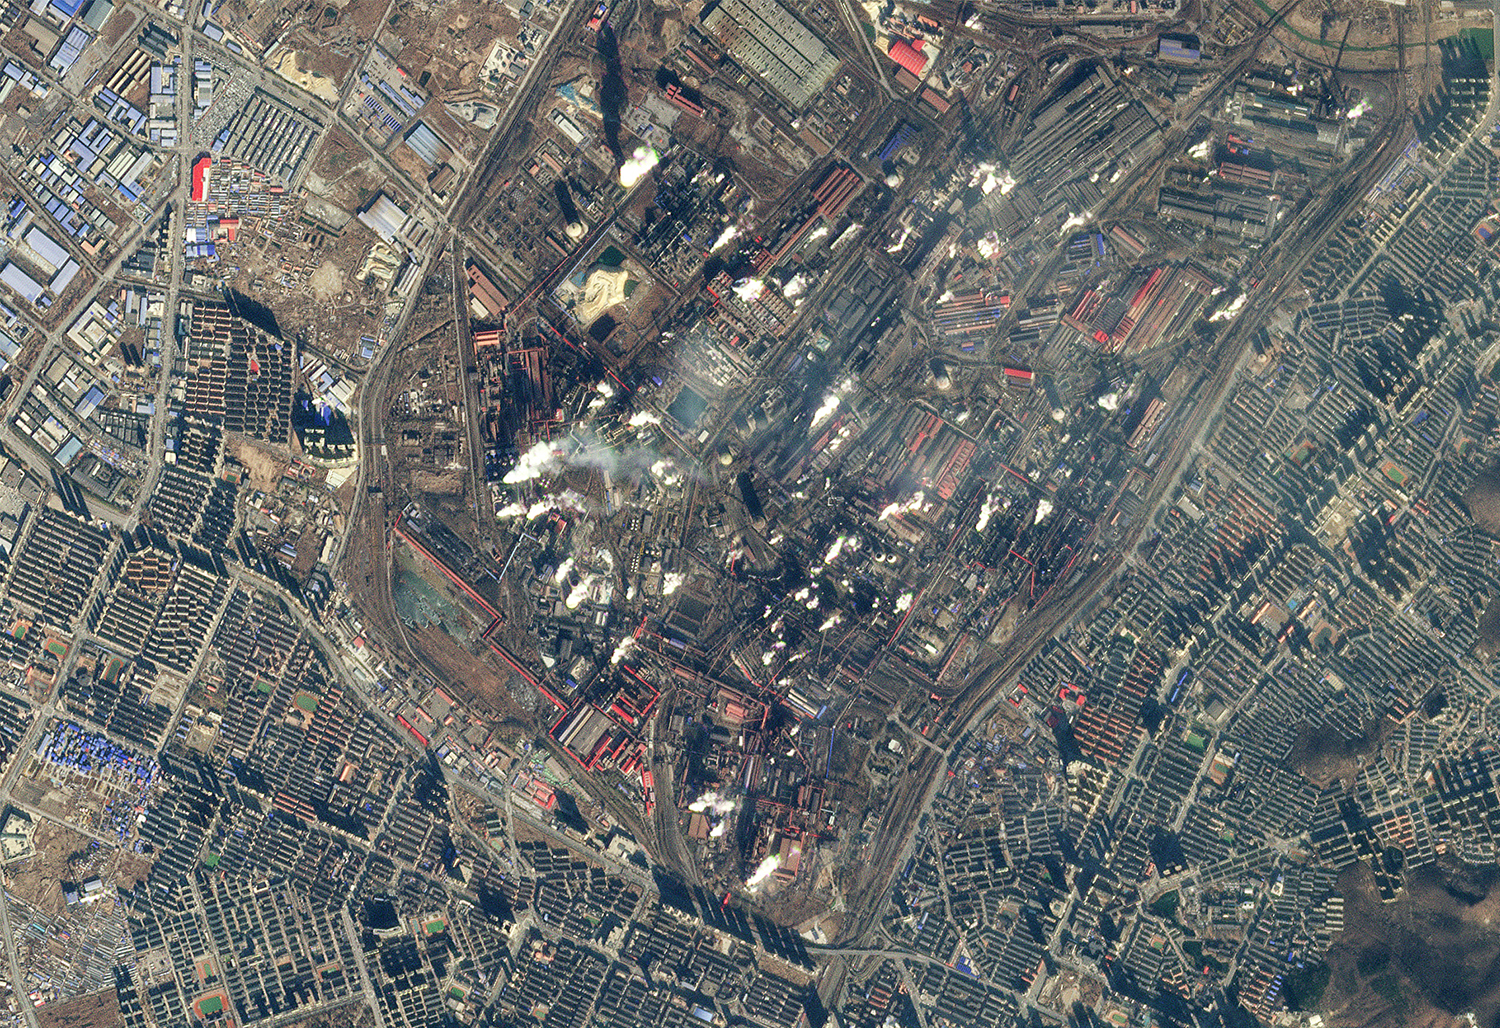
PlanetScope • Smokestacks, Anshan, China • November 30, 2022 |
It’ll ultimately require a herculean task to globally achieve a net zero carbon budget. But you can’t count to zero without knowing your current digit. And initiatives using satellites to help index and tally these carbon additions and subtractions can equip governments with the most accurate baselines to date. Of course, it’s still a bit like putting toothpaste back in the tube. If only we’d known a long time ago. |
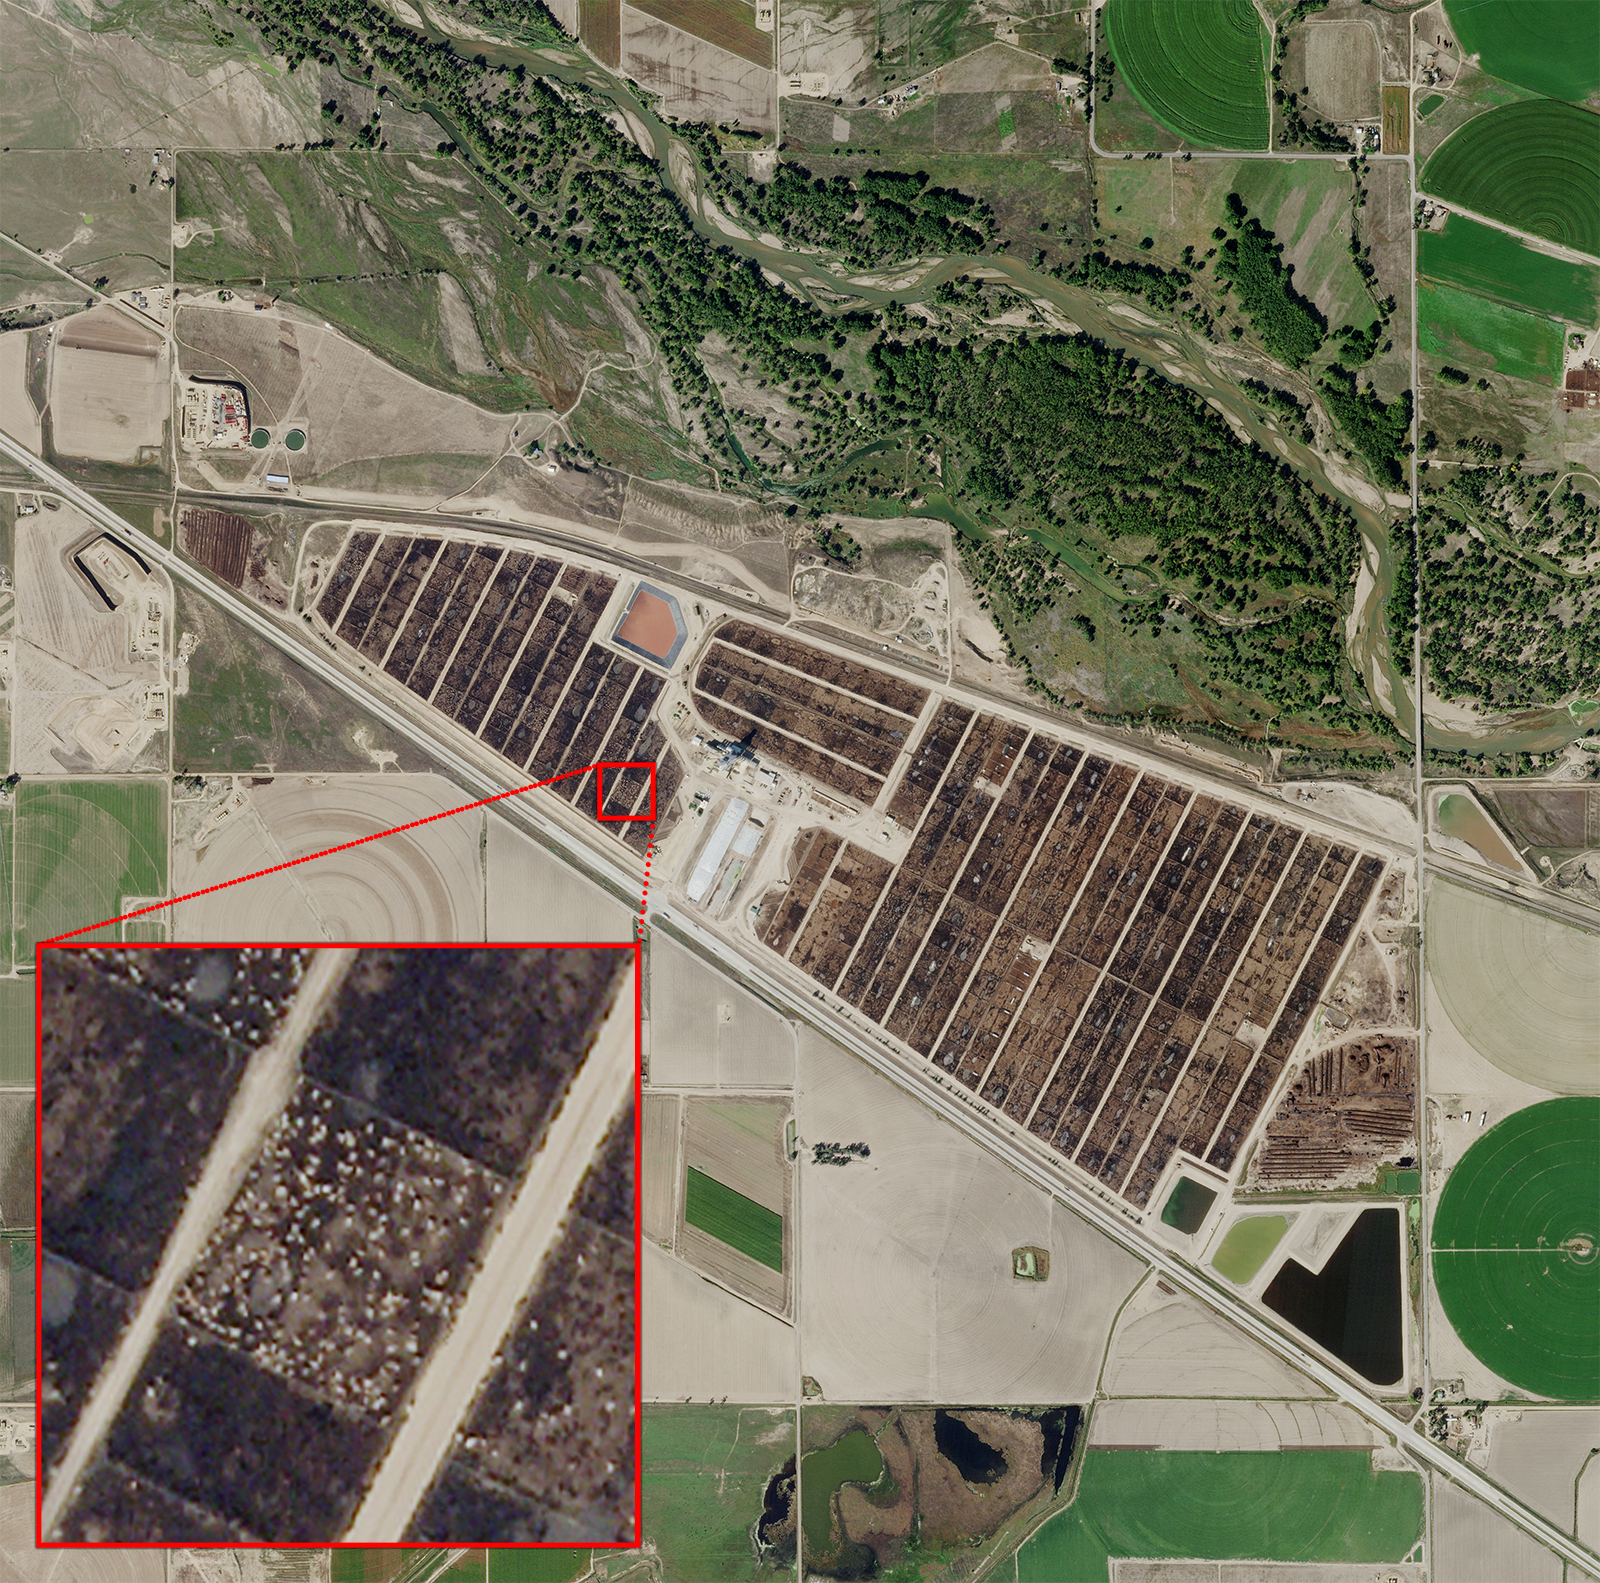 |
SkySat • Kuner Feedlot, Colorado, USA • October 6, 2022 |
We’ll see you in a few weeks for part 2 on blue carbon. Until then, enjoy the pleasingly square-like image above of a large cattle feedlot, a large source of methane, and Batagaika Crater, the world’s largest permafrost crater. The horseshoe crab-looking indent is actually far scarier than anything from the ocean’s depths. It’s a sign that Earth’s permafrost—the permanently frozen soils that cover 15% of land in the Northern Hemisphere—is melting and releasing greenhouse gases.
|
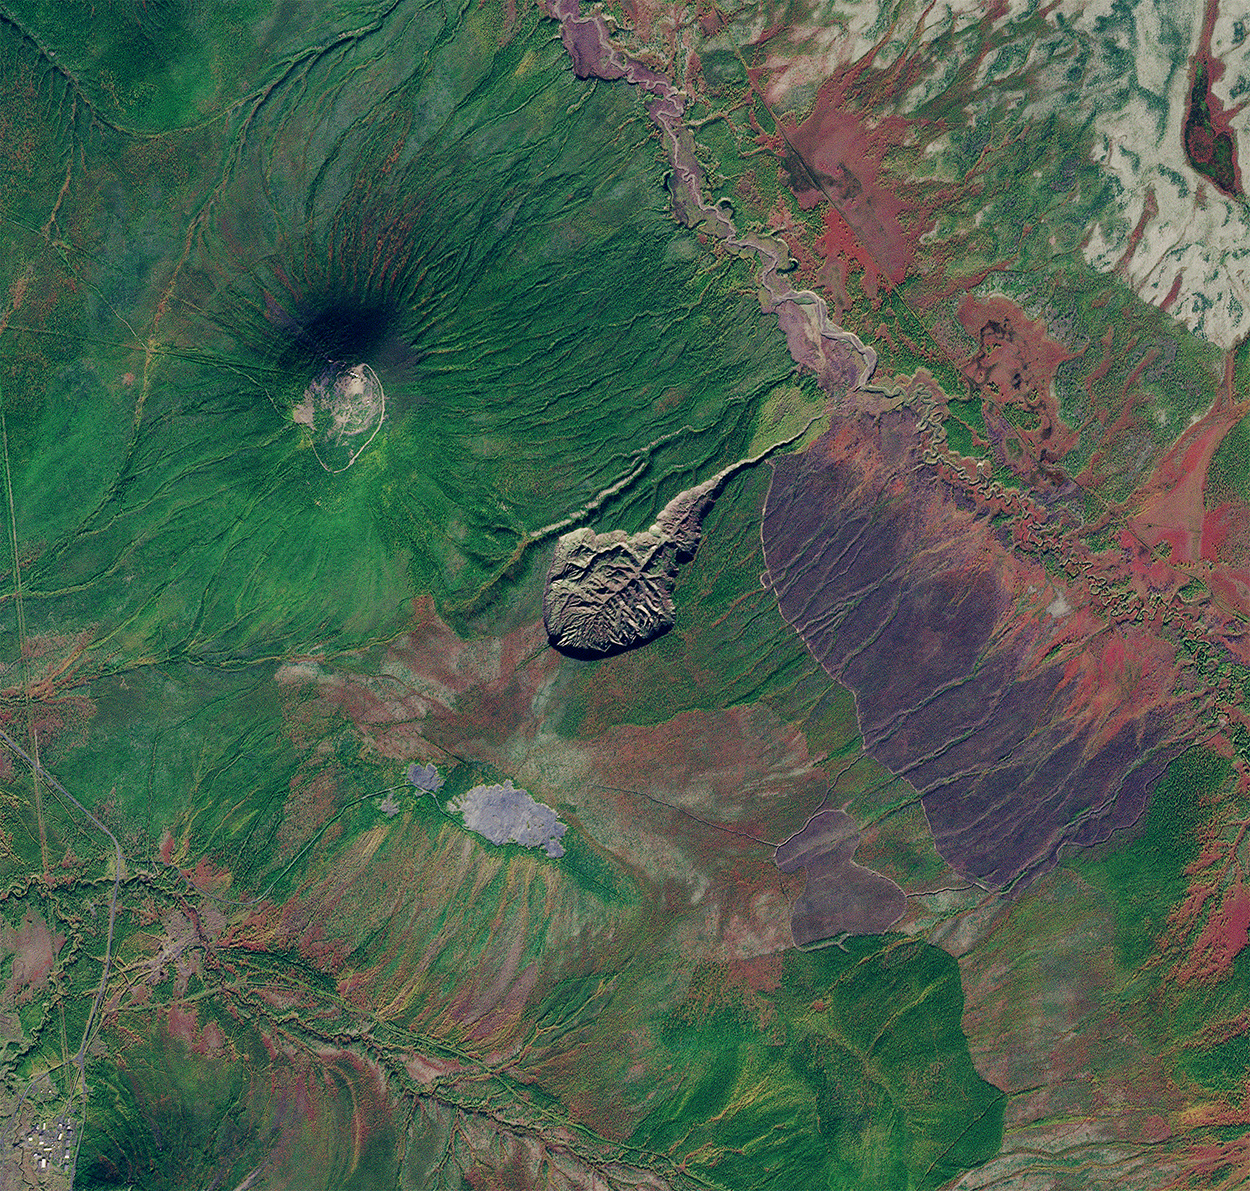 |
PlanetScope • Batagaika Crater, Russia• September 5, 2022 |
|
|
|
|
|
|
|
|
|
|
|
Remote SensationsThe Rains
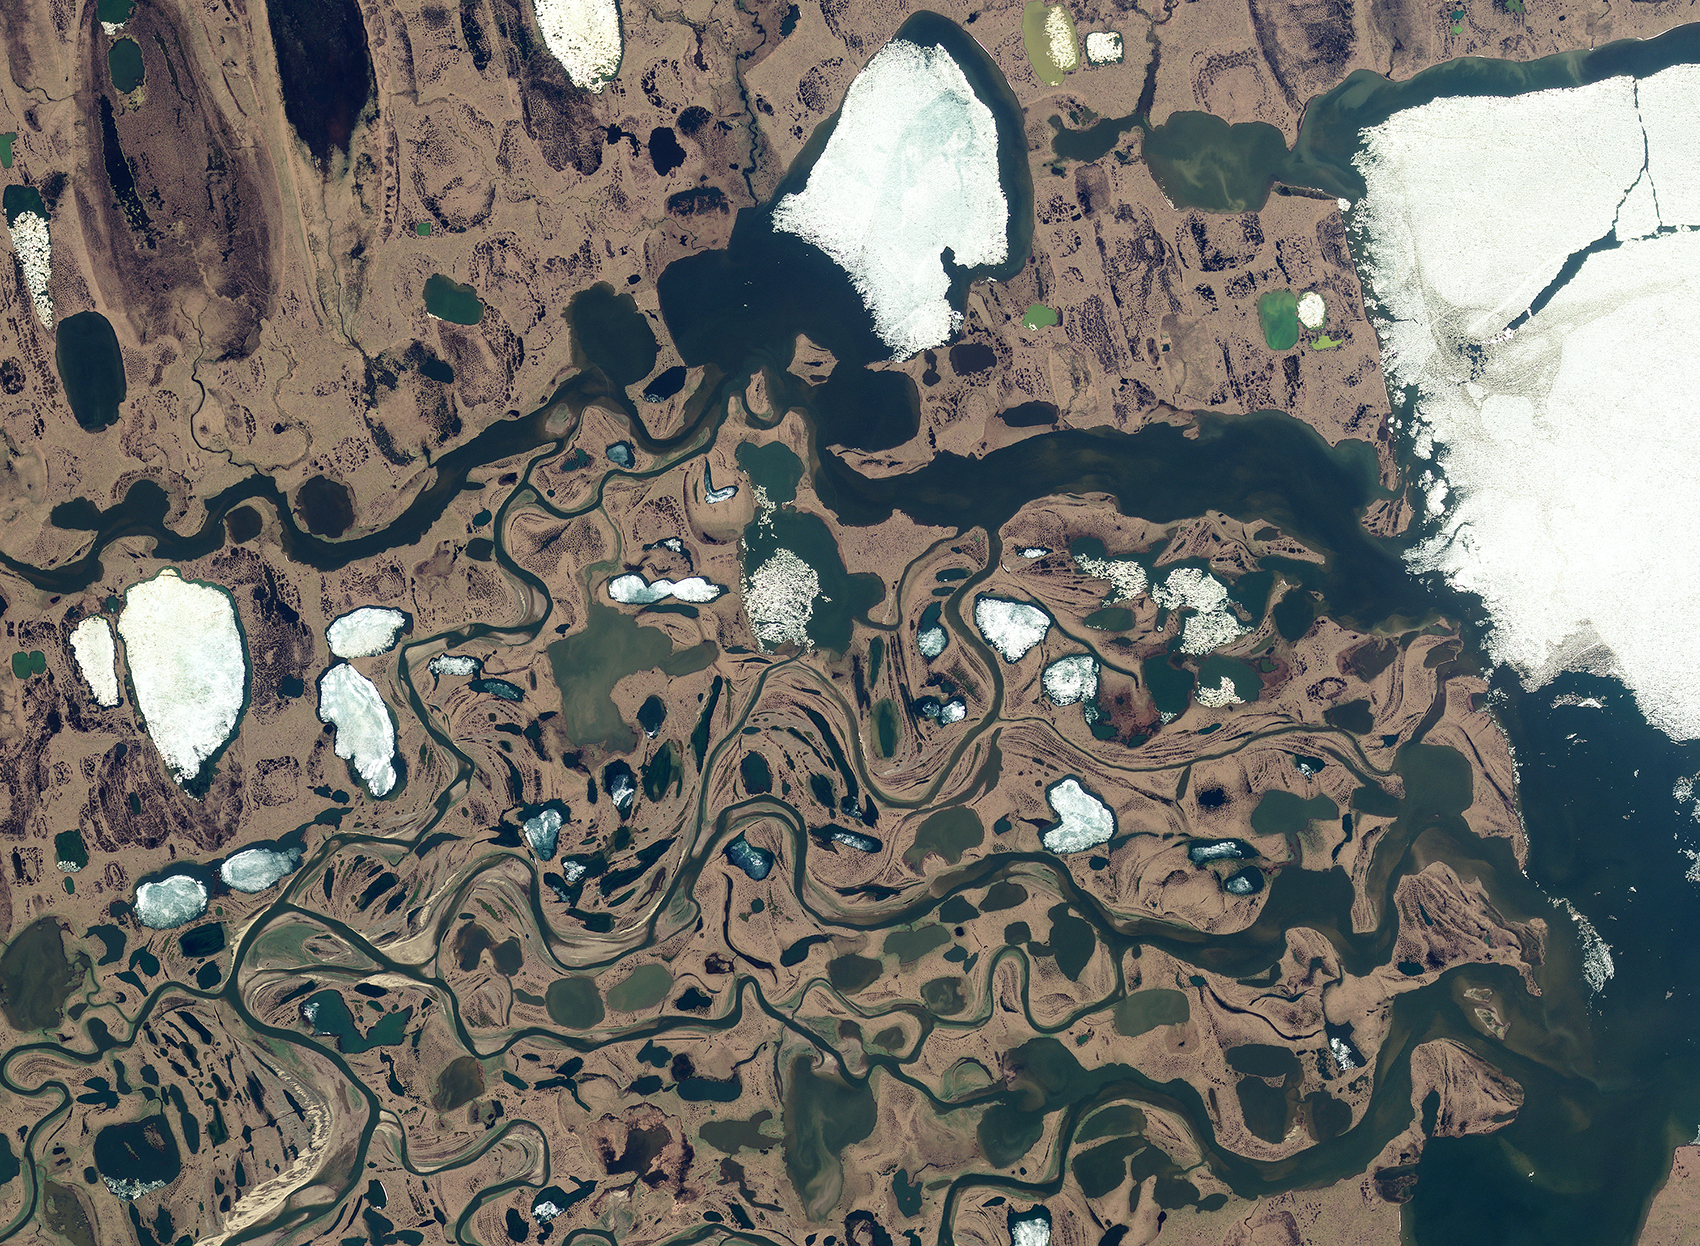
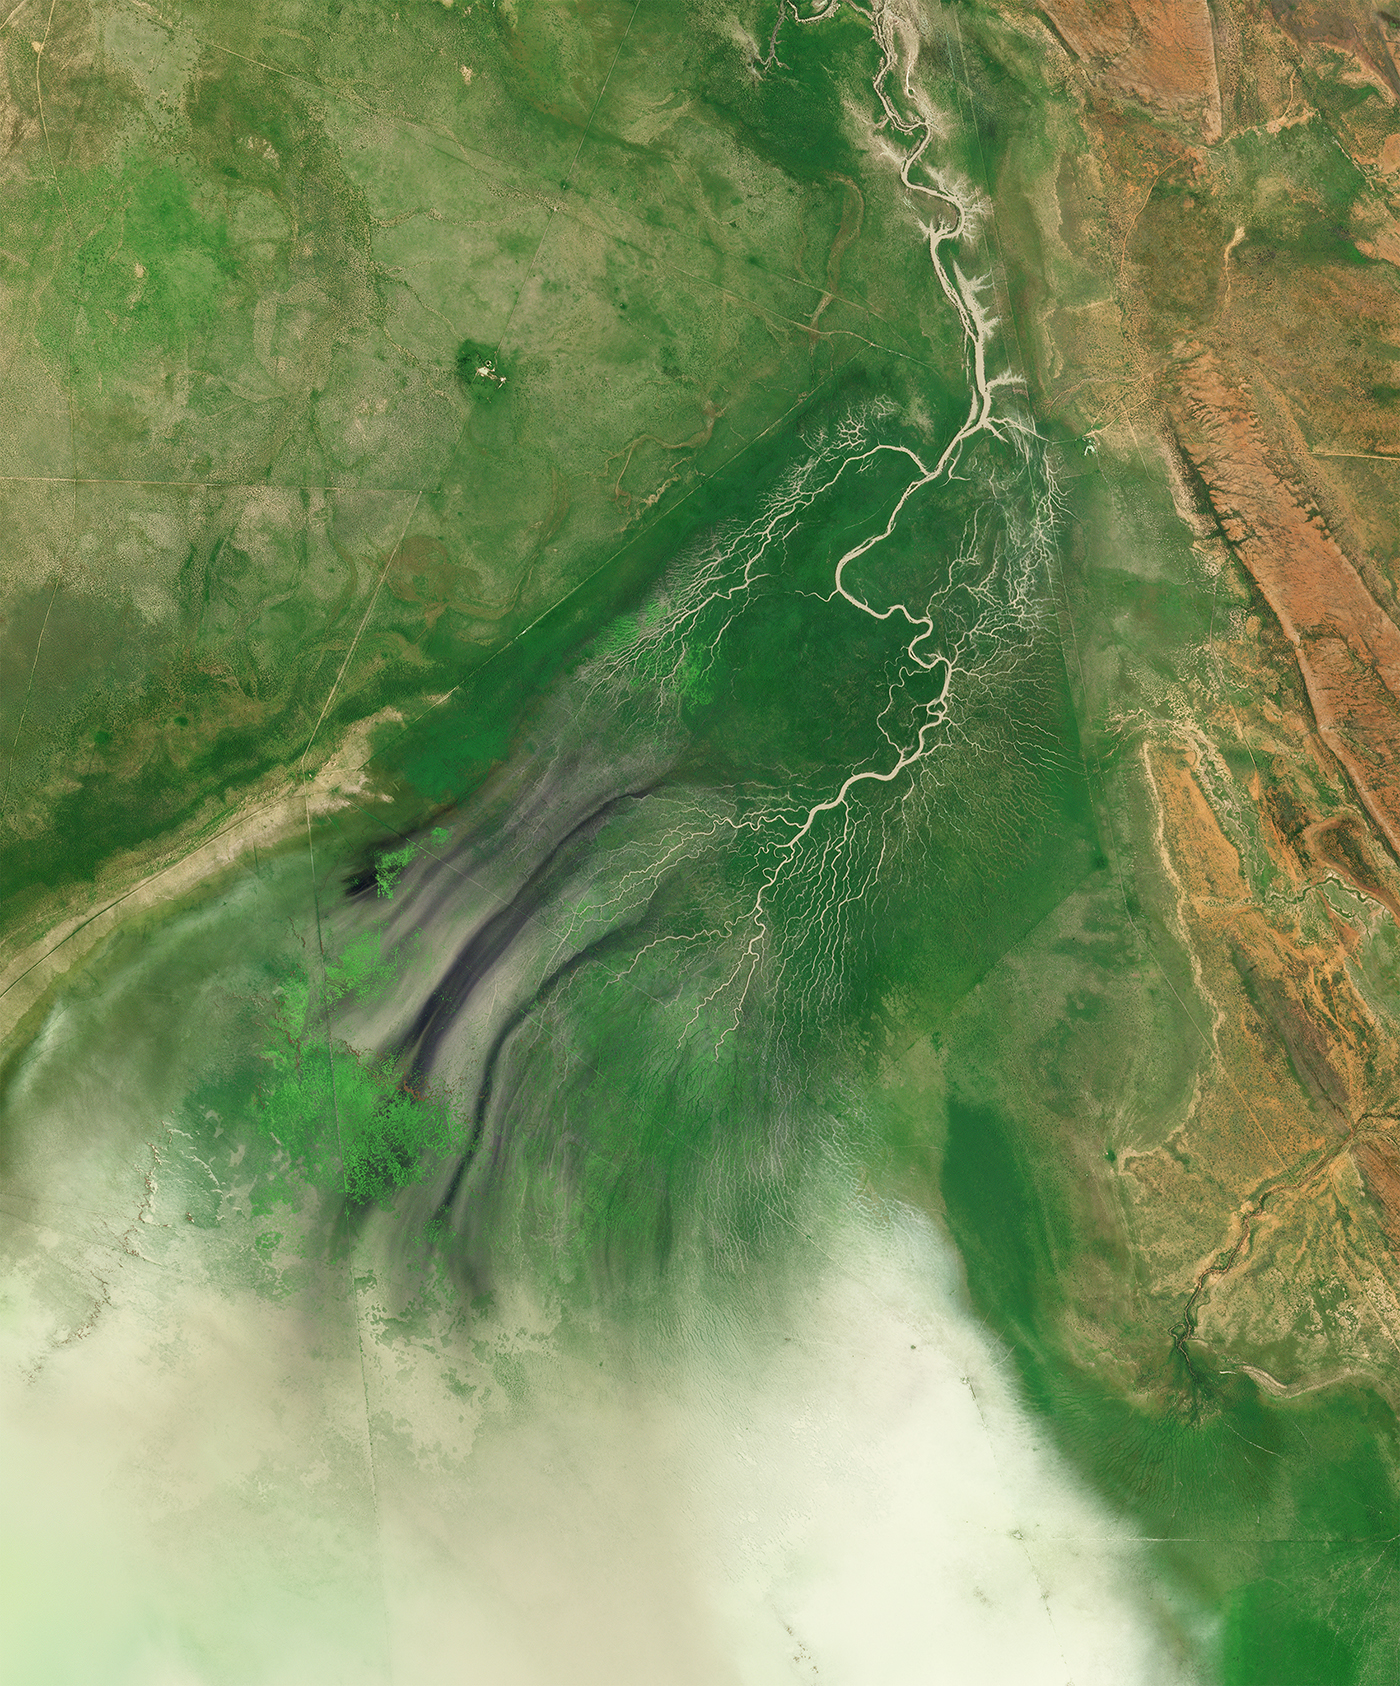
Some images have us saying “wow” more than Owen Wilson throughout his career. Rainfall poured over Australia’s Northern Territory earlier this month and filled waterways throughout the region. Take a look at some of the flood’s incredible patterns across the landscape. Down came the rain and hopefully washed the country’s supersize spiders out. |
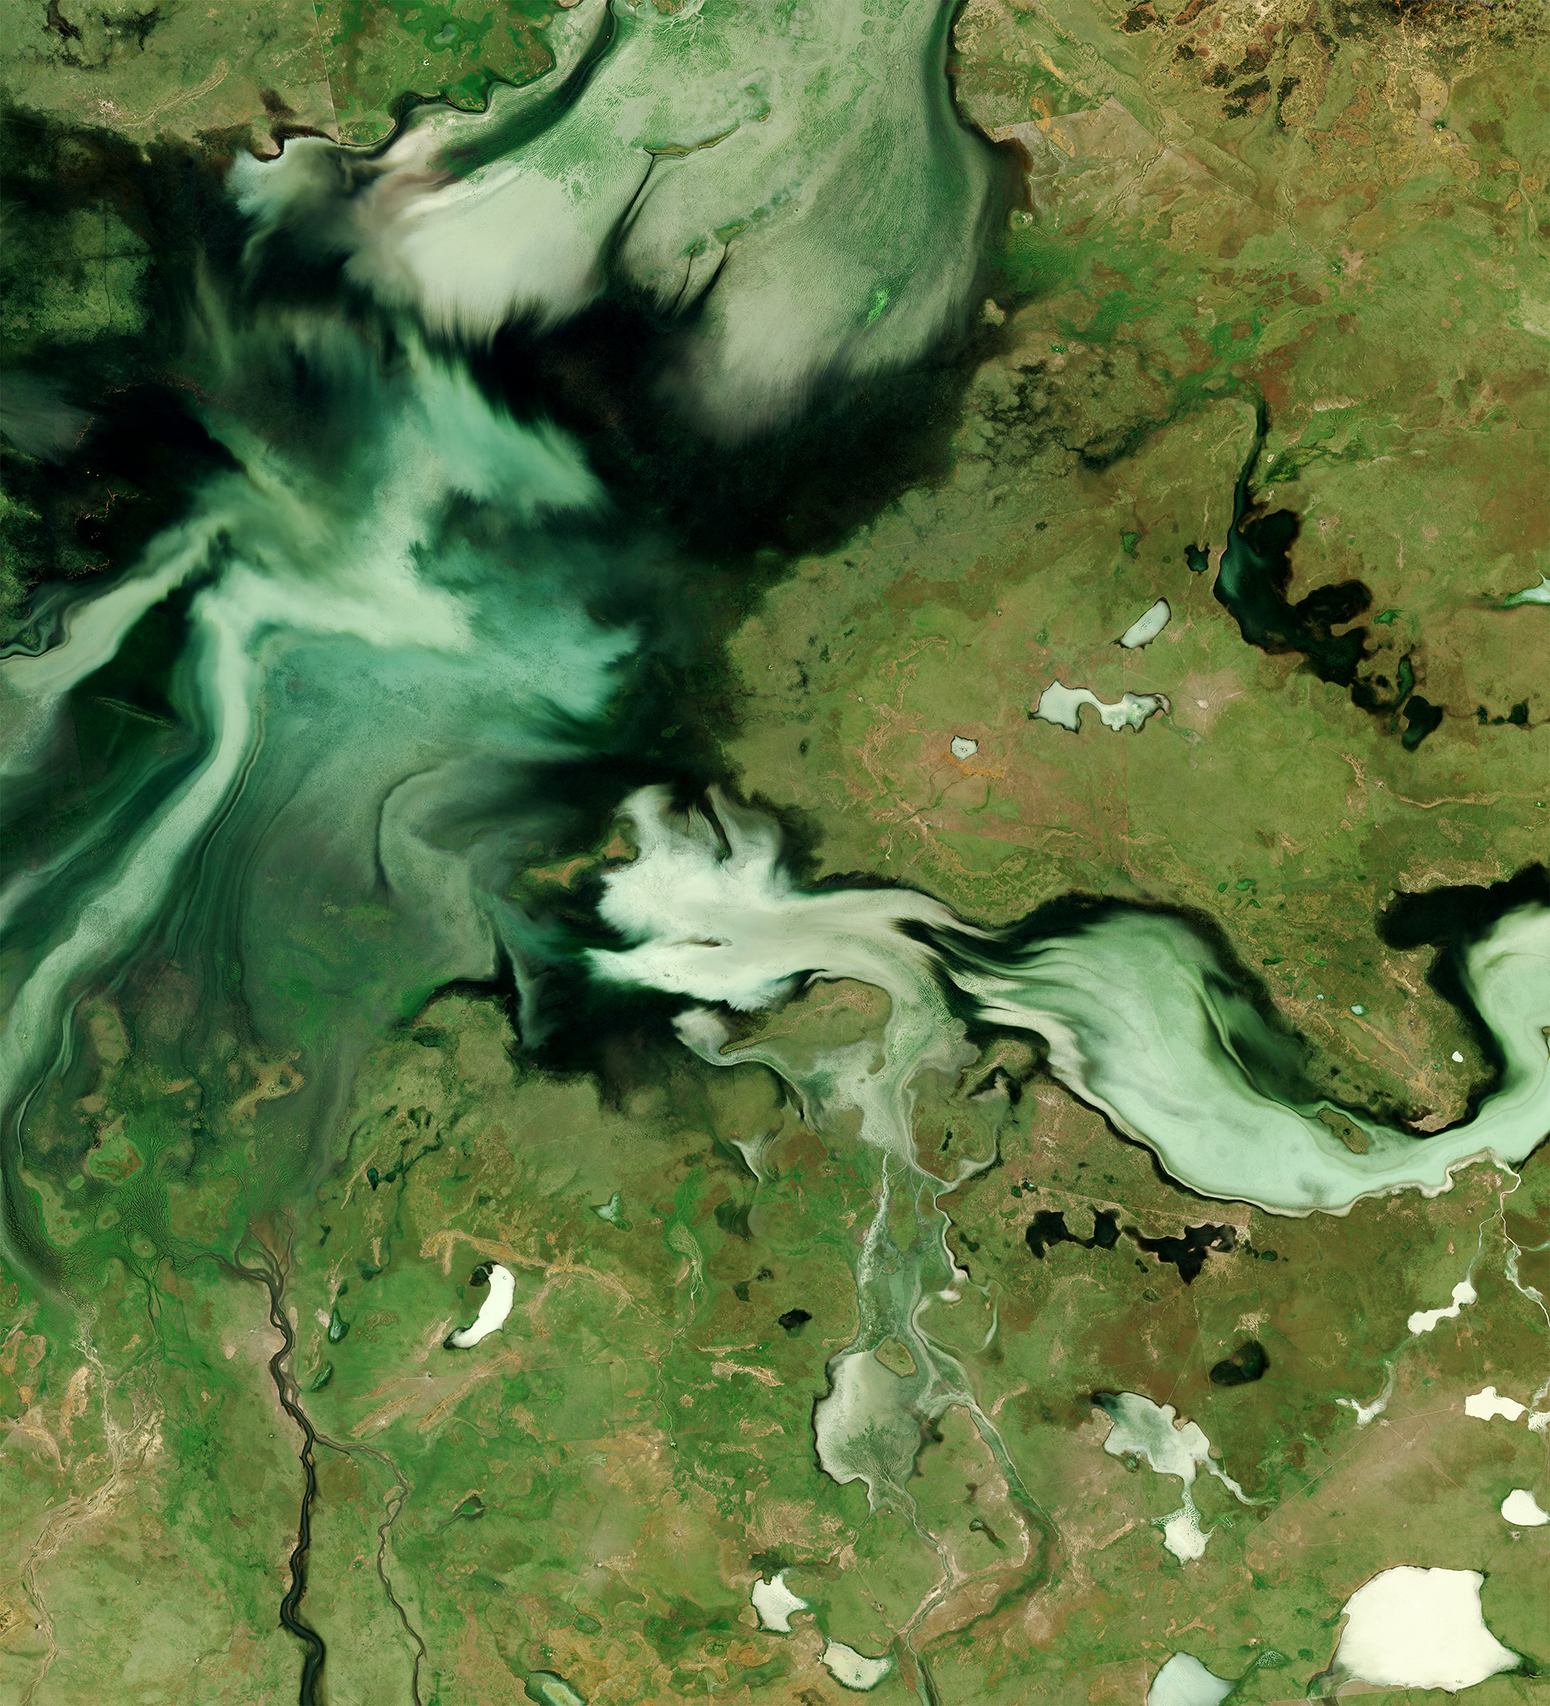 |
PlanetScope • Tarrabool Lake, Northern Territory, Australia • March 11, 2023 |
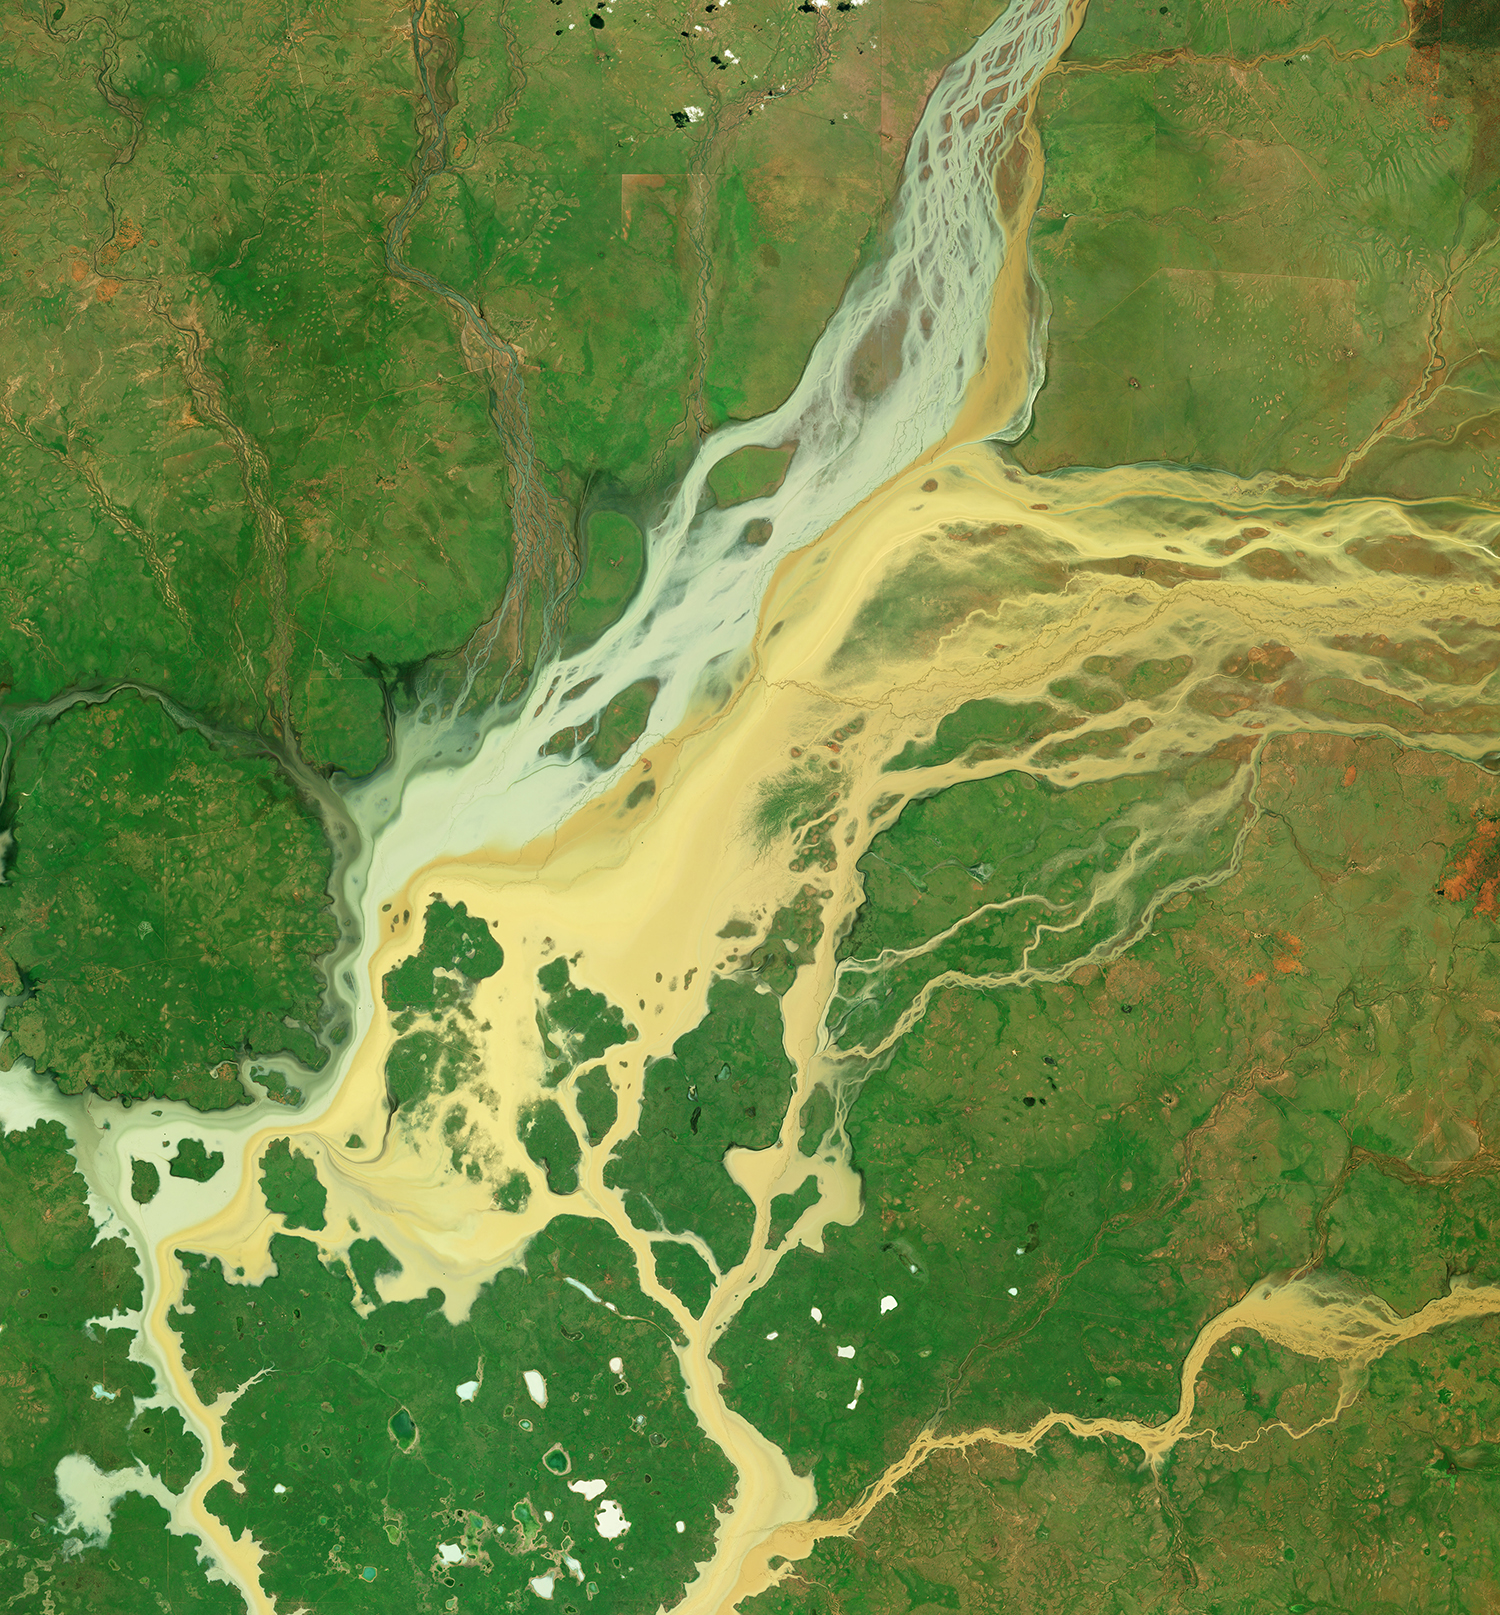 |
PlanetScope • Ranken, Northern Territory, Australia • March 12, 2023 |
 |
PlanetScope • Lake Woods, Northern Territory, Australia • February 6, 2023 |
|
|
|
|
|
satellite explainerDrones & Satellites
It probably goes without saying, but we’re big fans of aerial photography in all of its forms. And many of us are drone enthusiasts even though we primarily stick to the orbital satellite perspective. Each has their own unique benefits, especially when it comes to scale. Namely, satellites cover a far, far larger area but at a lower resolution. And drones cover a smaller area but at a higher one. This is why satellites can image entire cyclones or countries and drones can photograph individual sea turtles. |
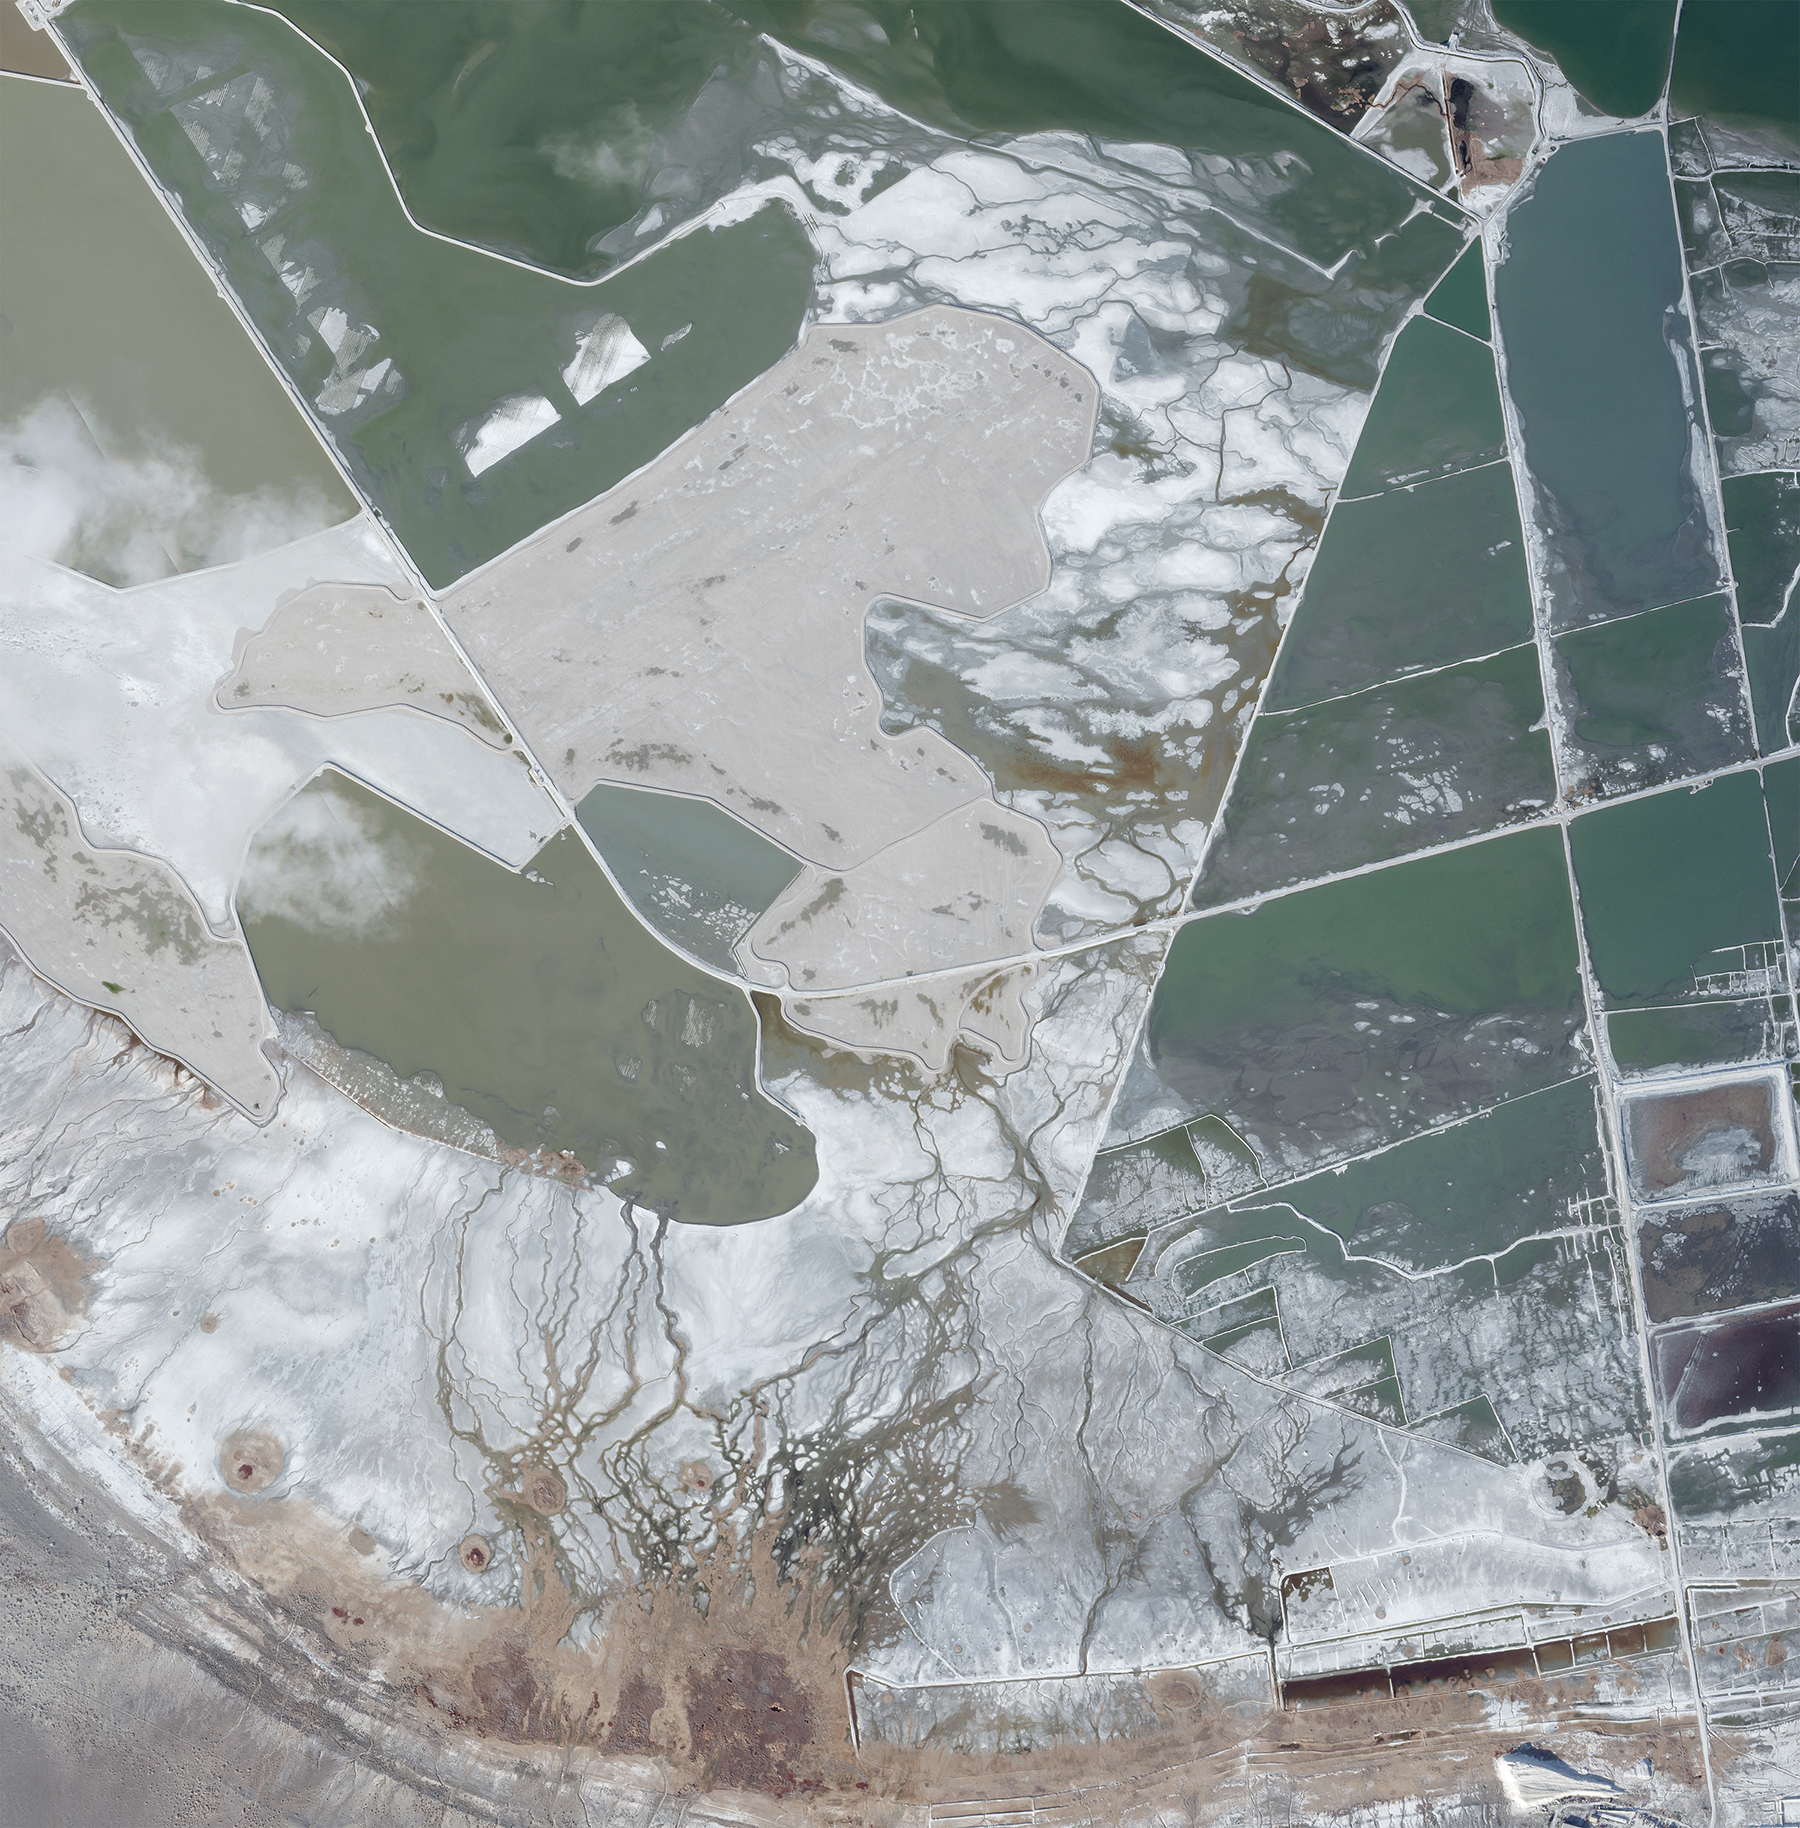 |
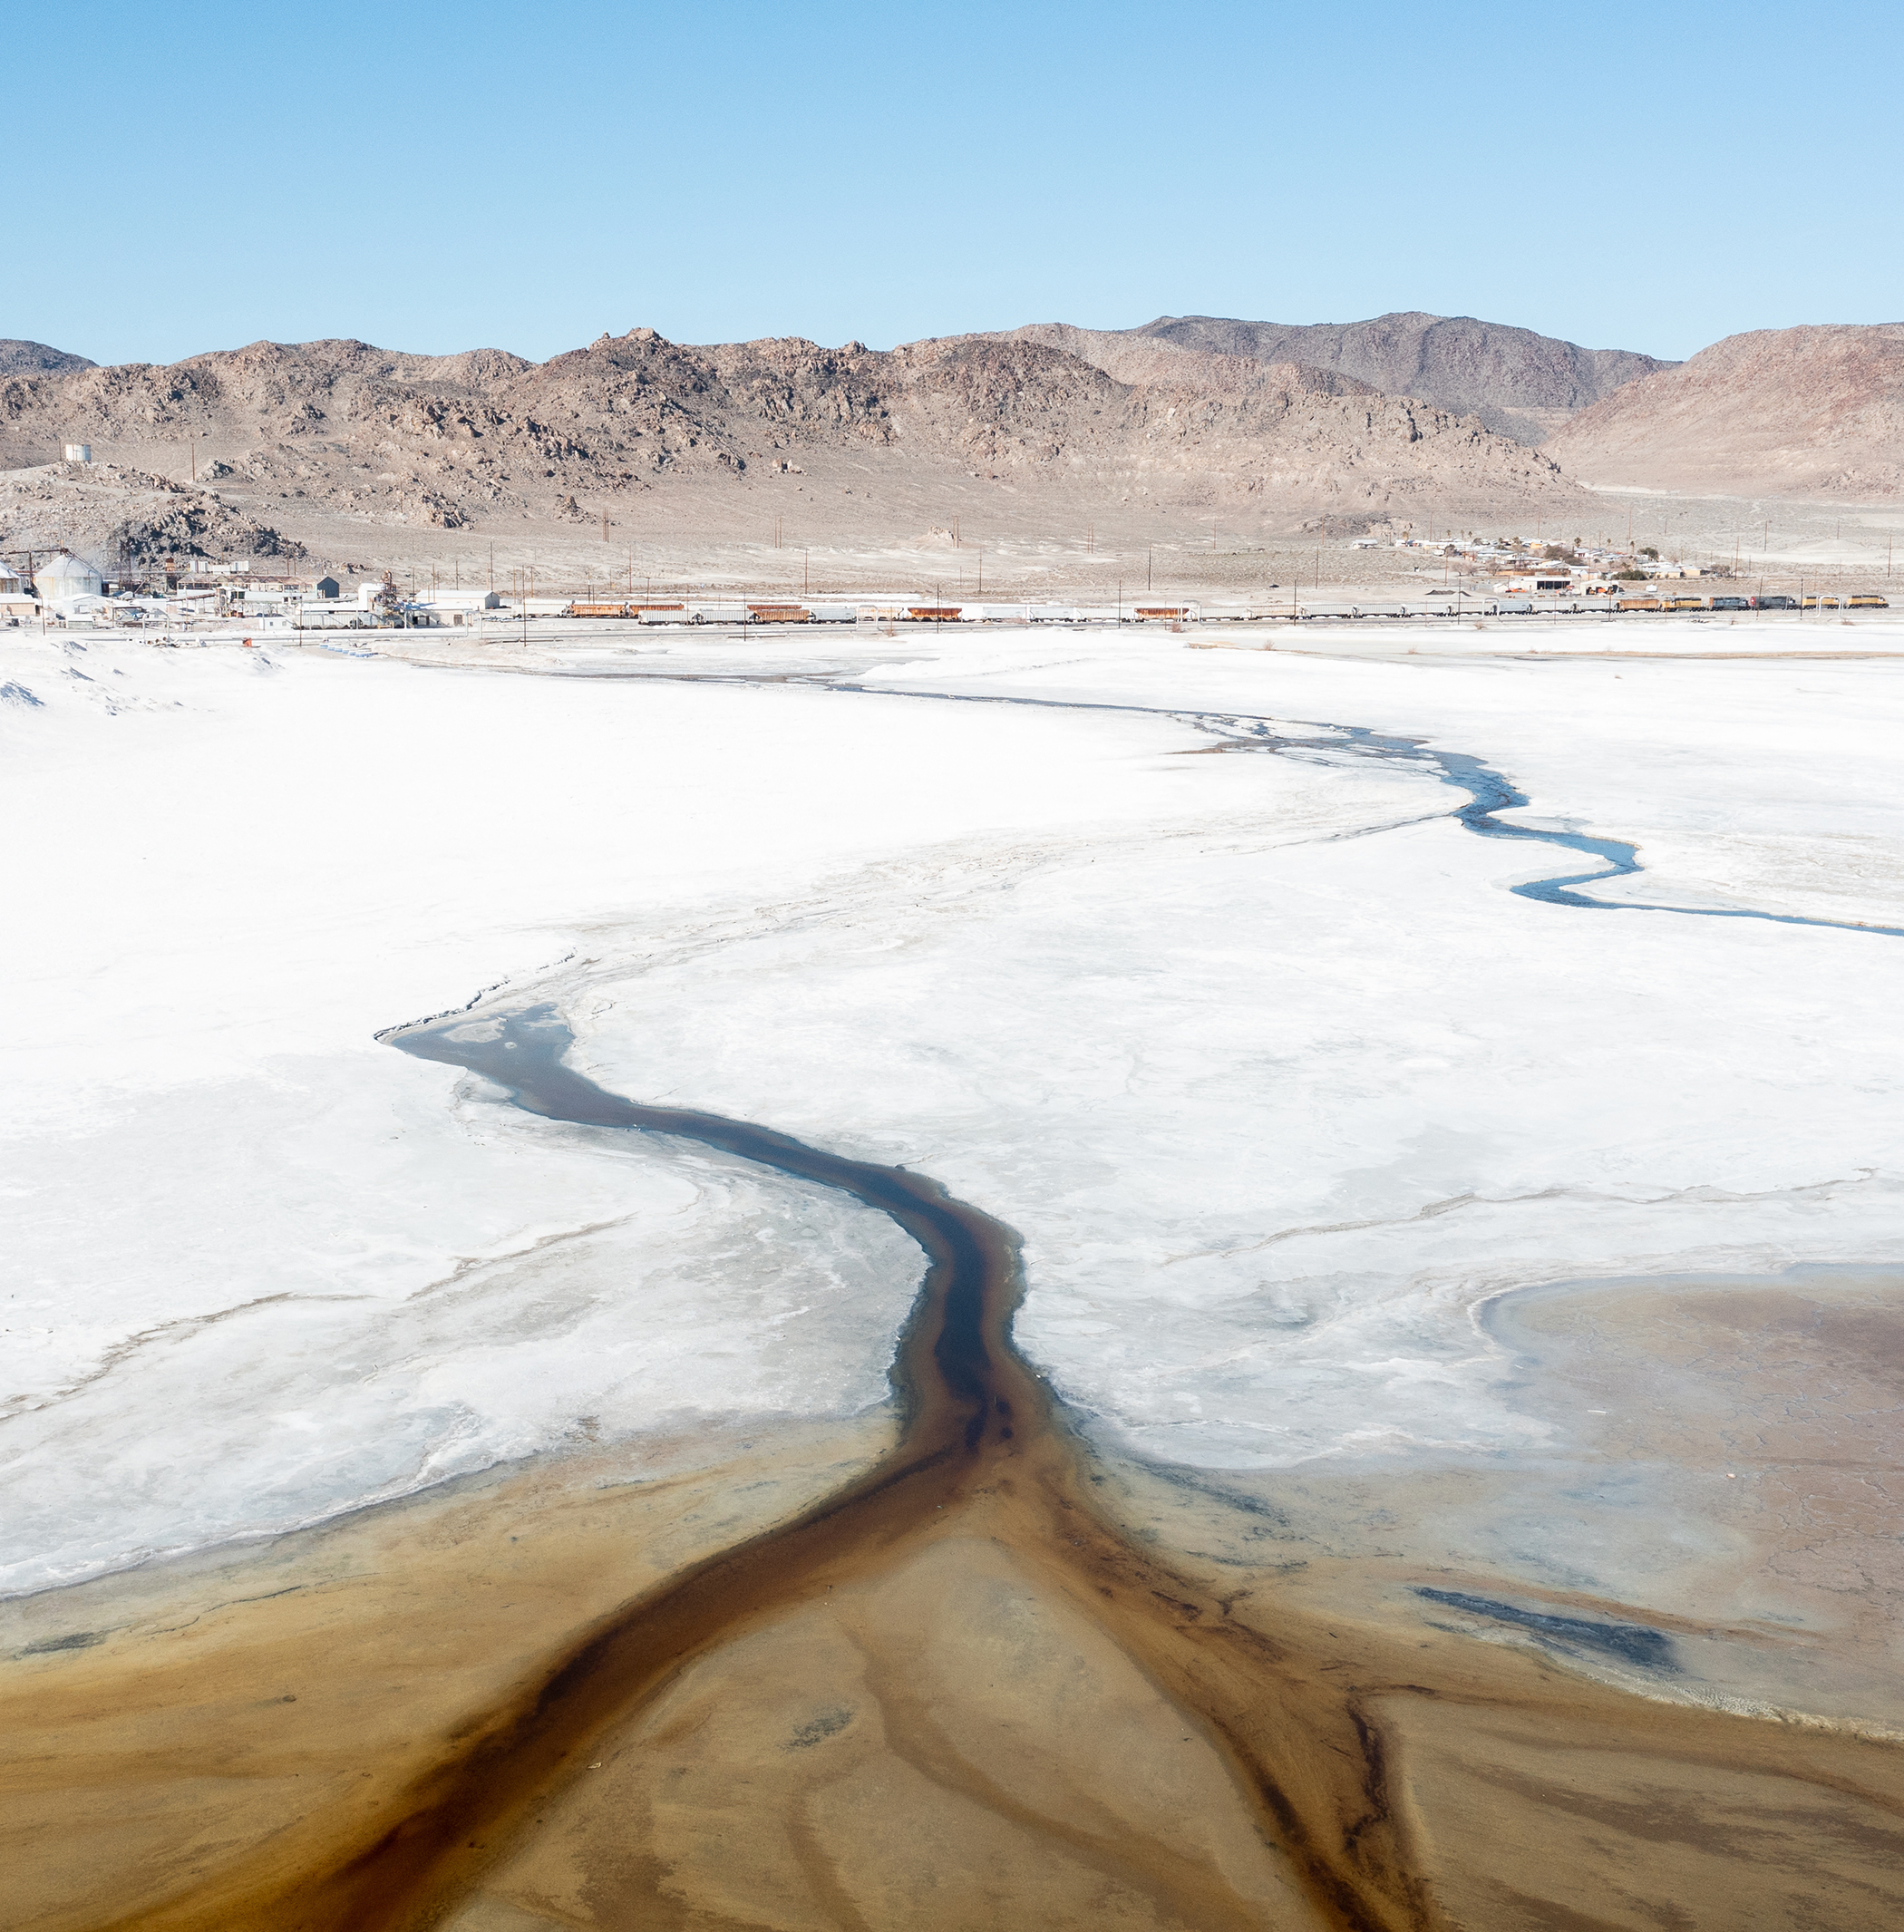
SkySat • Owens Lake, California, USA • March 5, 2023 |
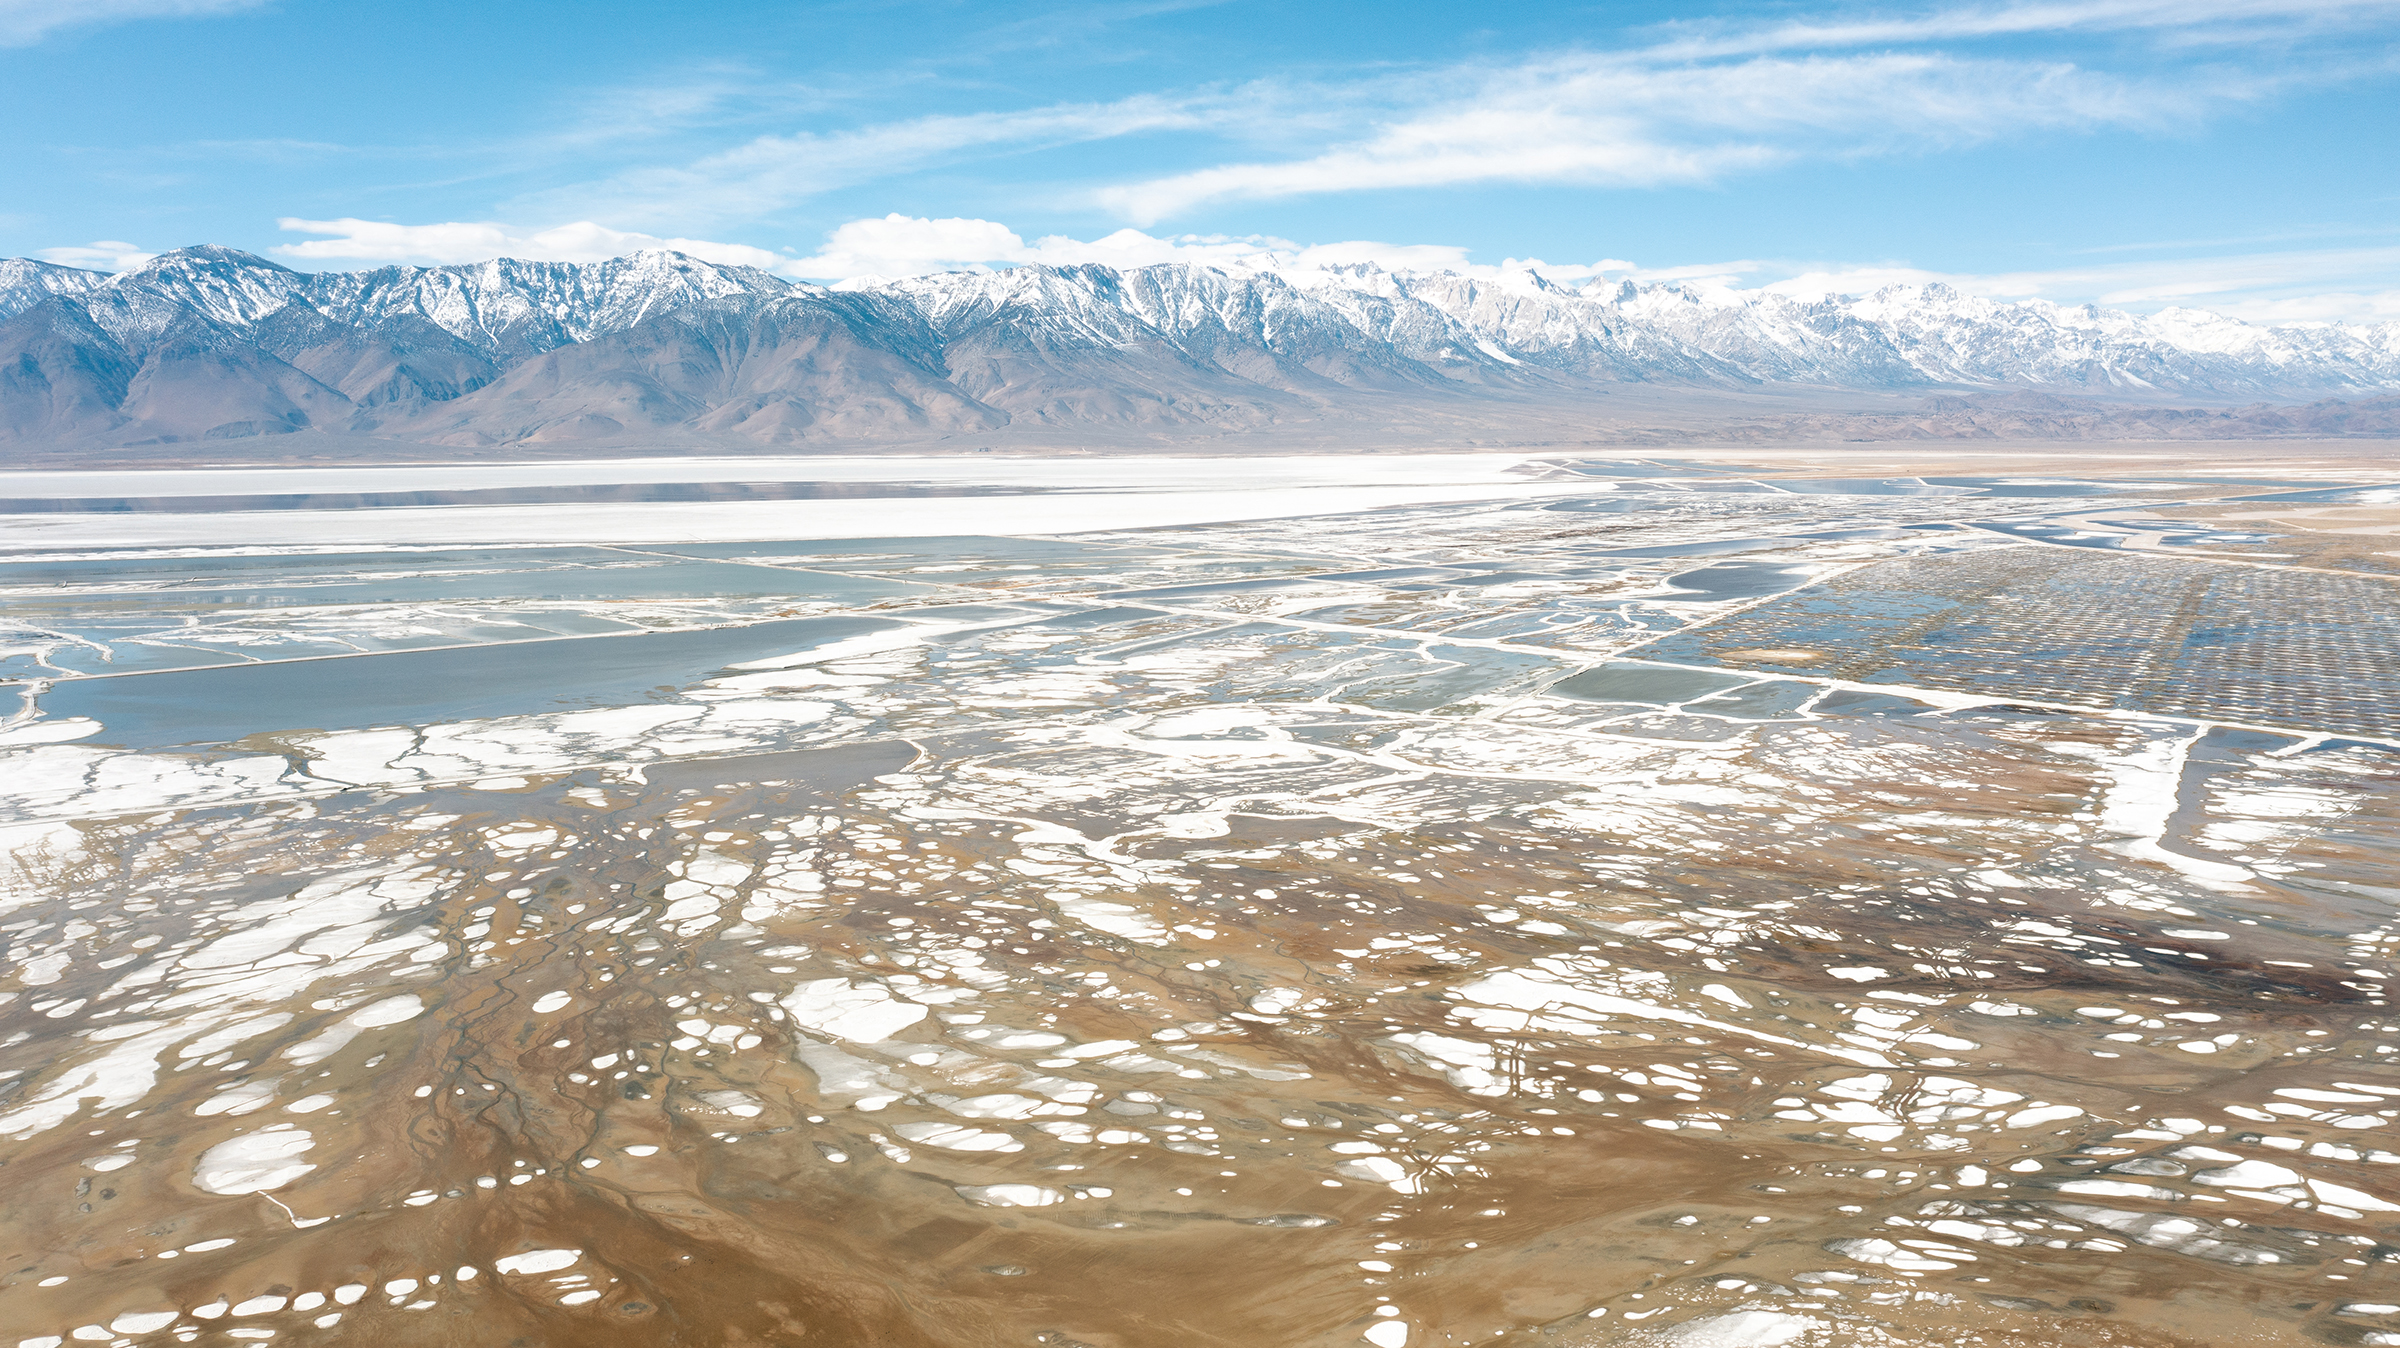 |
Drone • Owens Lake, California, USA • February 20, 2023 |
But they can also be paired together to get the most out of both. In conducting damage assessments after the Dixie Fire in 2021, the Sheriff’s office used high resolution satellite data to plan flight paths for the drone, which it then collected data on the safest routes through the town and areas that needed prioritized inspections.
Take the following images for example. The above is from our highest resolution satellite, SkySat, at 0.5 meter and the bottom two below are from a DJI Mavic 2 Pro. Same place but different perspective. Can you spot the part of the SkySat image where the drone was positioned?
|
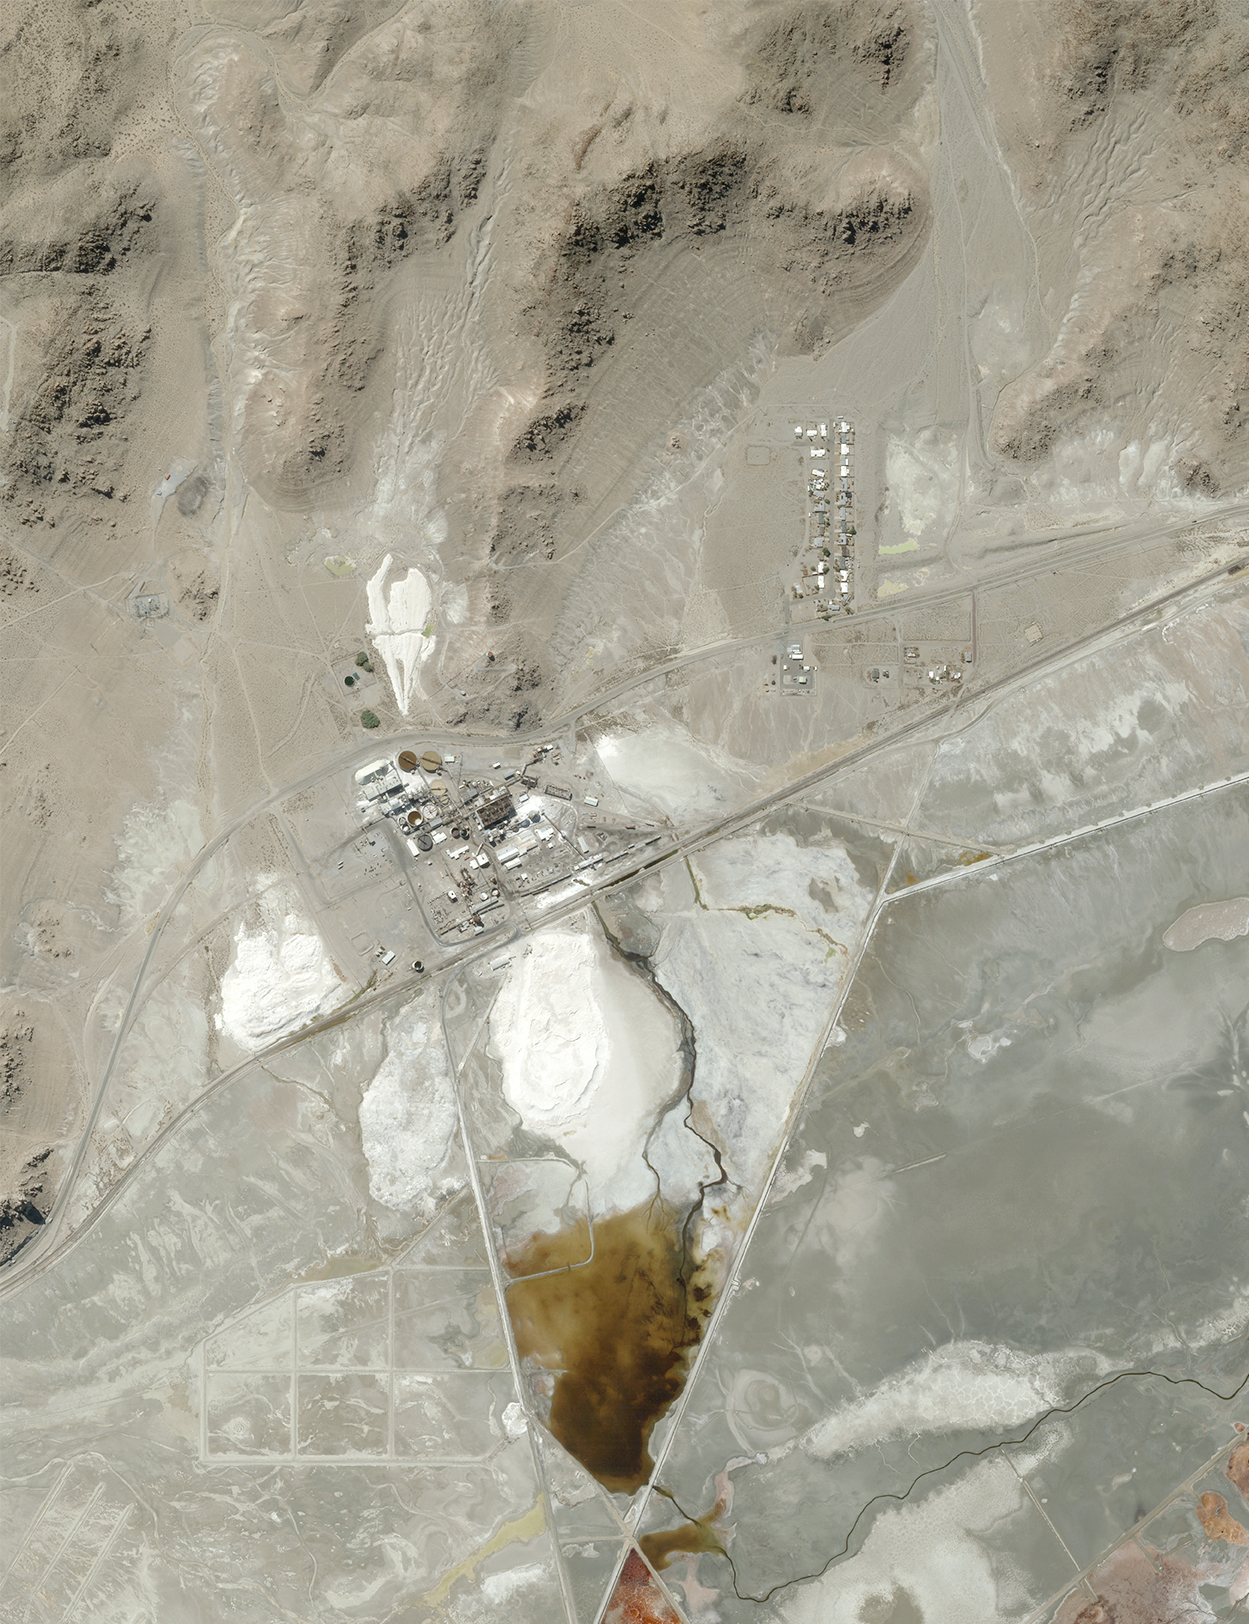 |
SkySat • Searles Lake, California, USA • September 21, 2022 |
 |
Drone • Searles Lake, California, USA • February 20, 2023 |
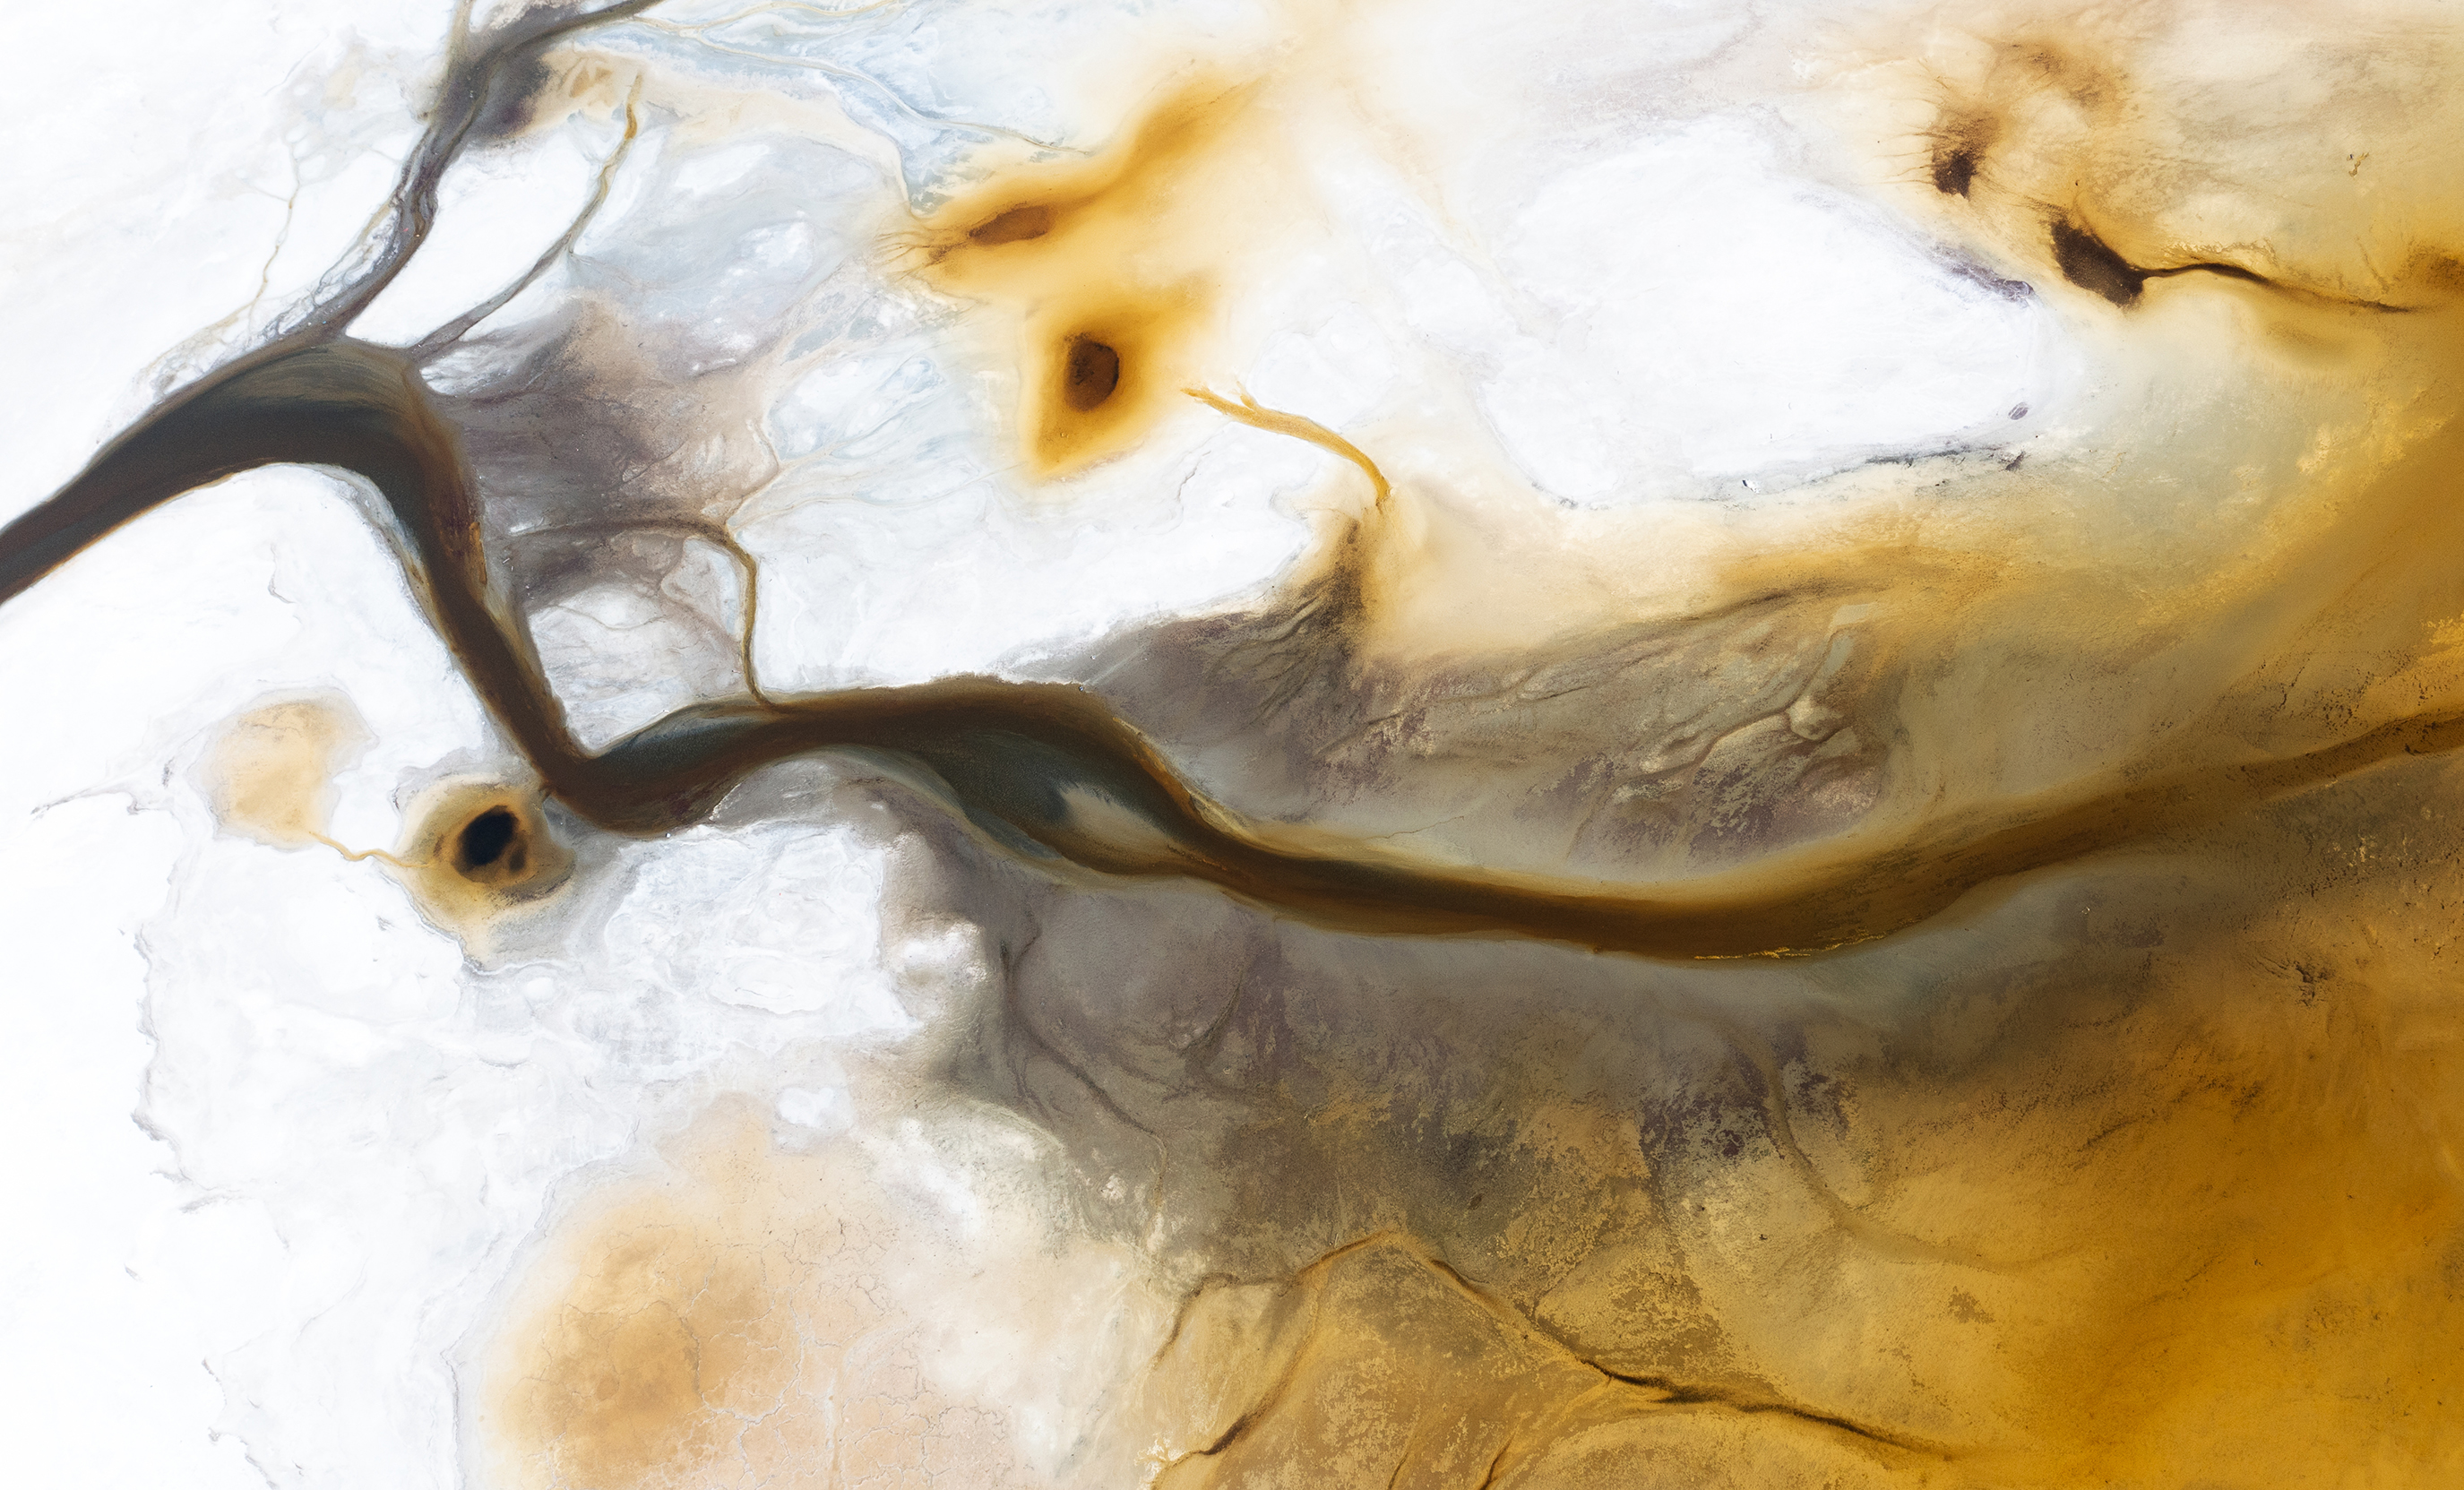 |
Drone • Searles Lake, California, USA • February 20, 2023 |
|
|
|
|
|
Weekly Revisit
Last week we explored likely large-scale migratory trends as a result of climate change. So check it out in case you missed it and read more stories from the full archive if you’re extra curious. |
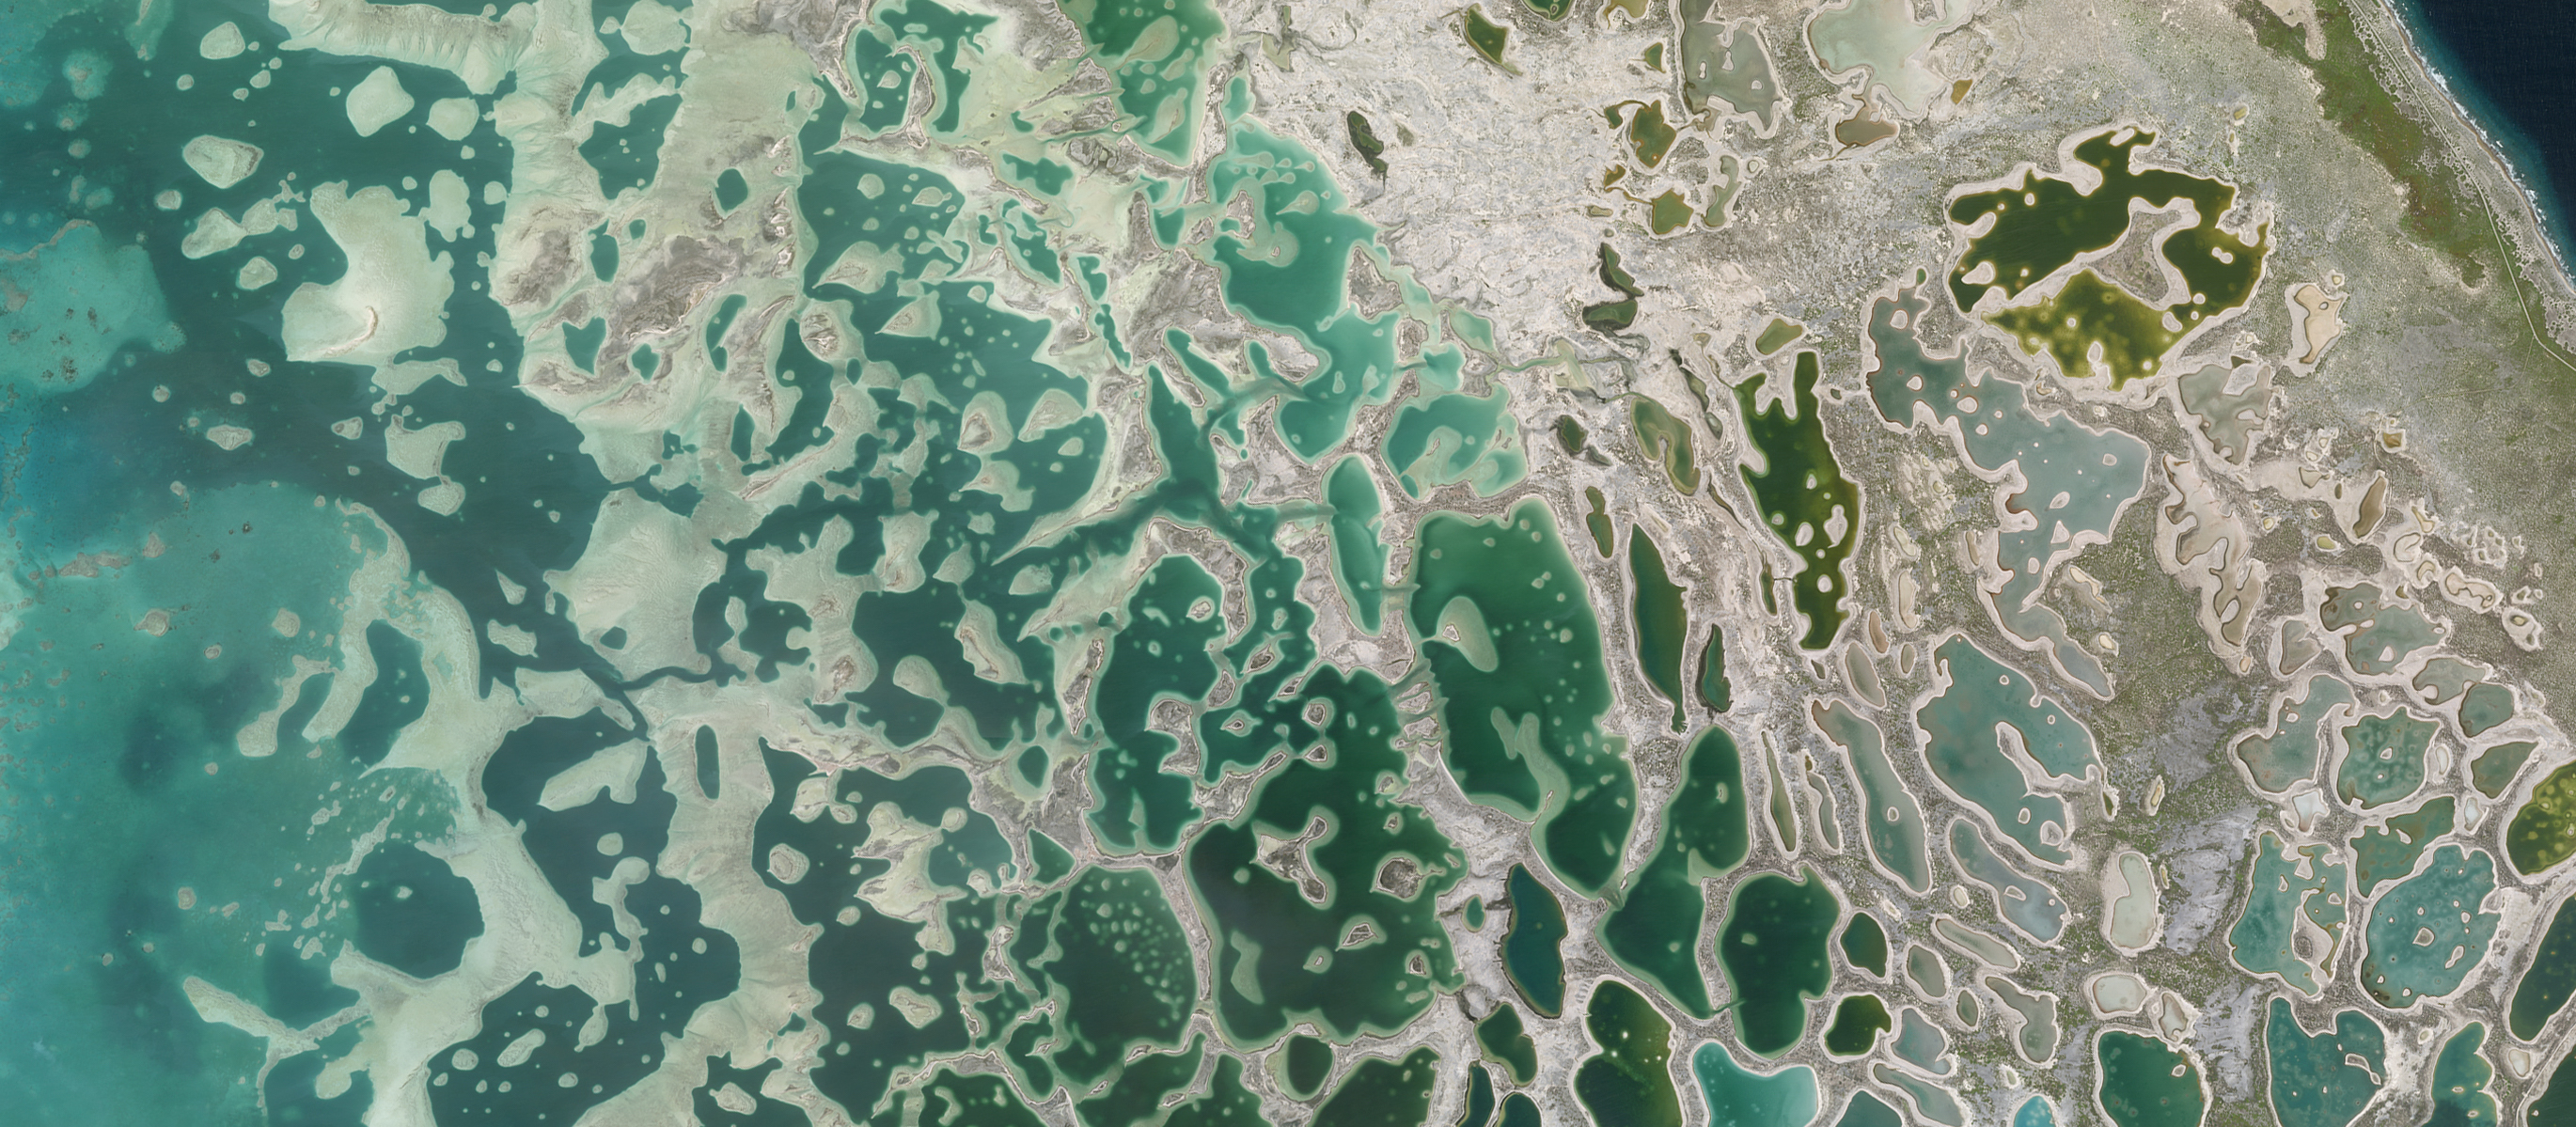 |
SkySat • Kiritimati, Kiribati • June 21, 2022 |
|
|
|
|